Volatility is a common denominator in the financial market. While many traders love it, it is hated by many long-term investors.
We’re a day trading company, so it’s easy to see why we love fluctuations and want to do what we can to help you master them. In this article, we will look at what volatility is, some popular indicators that can help you, and you can trade in high volatile markets.
Volatility definition
Volatility can be defined as a period when the financial market or a specific market is showing significant moves.
For example, if a stock opens at $50, rises to $55 and then closes the day at $45, it could be said to be a volatile stock. The same can also be said about a currency pair that opens at 1.1200 and rises to 1.1300 and closes at 1.11100.
Some of the most volatile sessions happen in periods of high uncertainty. For example, the stock market experienced strong fluctuations in 2020 as the Covid pandemic. Similarly, the market showed significant movements during the dot com bubble and during the housing crisis.
Causes of volatility
There is no singular cause of volatility in the financial market. Still, there are some factors that leads to these situations, including:
- Earnings – Stocks typically show some volatility before and after they publish their quarterly results (some tips about earning season).
- Management change – A company’s share price can show some strong movements after its CEO steps down or after it hires a new executive.
- Economic data – Some economic data like employment and inflation tends to lead to volatility in the market.
- New product launch – A company can show some up and down in its shares after it launches a new product.
- Commodity prices – At times, commodity prices can lead to volatility in stocks. For example, oil stocks may crash when crude oil prices fall.
How to identify volatile stocks
Identifying volatile stocks is relatively easy. We recommend that you first look at the performance of key indices like the Dow Jones, S&P 500, and Nasdaq 100 and see how they are moving. If the Dow Jones is up or down by more than 500 points, it is a sign that the overall market is volatile.
Next, you should look at key volatility indicators like the fear and greed index and the CBOE volatility index (VIX). Identify their patterns to see whether the market is calm of highly volatile. For example, if the VIX index is at the highest level in a while, consider that the market is volatile.
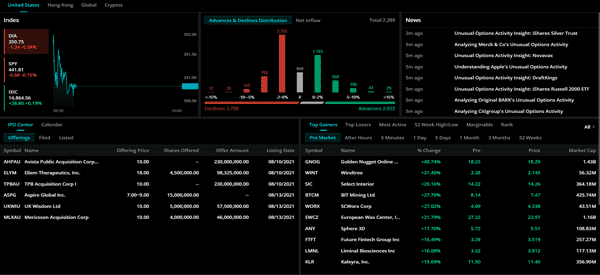
Finally, look at the top movers during the session. For example, the chart below shows the top movers at the time of writing this. You can also look at the top losers during the session.
Top volatility indicators
A good way to trade in high periods of volatility is to use some technical indicators. Some of the most popular volatility indicators are the Bollinger Bands, Keltner Channels, Donchian Channels, and the Average True Range (ATR).
The ATR is one of the most popular volatility indicators. It riseswhen the market has many fluctuations and retreats in periods of relative stillness . You can read our guides on how to use the Bollinger Bands, Keltner Channels, and Donchian Channels by following the respective links.
Trading strategies and tips
Expect the unexpected
The first thing you need to do is to always expect the unexpected. Even when the markets seem calm, always expect the unexpected to happen. Remember that anything can happen within less than a second in the financial market.
Therefore, in every trade that you open, always expect the unexpected no matter what kind of analysis you did.
Protect your trades
This follows the above point. As you expect the unexpected, you should do the best you can to protect your trades. This means that you should do two things:
– Place trades that are not very aggressive. The lot size that you select should be relatively small. This ensures that the maximum loss you can make is small as well.
– Ensure that you have a stop loss in all trades that you open. As we mentioned, a microsecond can be the difference between you and success.
Overnight trades
We have never been a fan of overnight trades. This is because so much happens at night that could have implications on your trades.
Remember, when the markets are closed in the United States, they are usually open in Asia. This means that Japan or China can do something that can move the market. The point also applies in the other way around.
What does this mean? Well, if you’re not at your trading desk, and you haven’t set up any market orders, you have no control over what happens to your account. Both positive and negative.
Be informed
It is very important to be informed about what is happening around the world especially when you have open trades. Before you open a trade, you should always look at the economic calendar. This will prepare you on what to expect if data is released.
» Related: How to Set Up the Next Day Trading Week
As a rule, We always stay out of the market a few hours before data is released. When you have a trade open, you should be informed of what is going on. The best way to do this is to have financial TV on.
You should also have financial apps with their notifications on. This will update you when anything significant happens. Social media is also a great source of very fresh news, but be careful to build a proper feed and avoid listening to fake experts.
Finally, you should monitor the VIX index. This is known as the fear index. It is the index that people in Wall Street track to know the nature of the volatility in the market. If it’s very high, you should stay out of the market.
External Useful Resources
- 3 Option Trading Strategies To Profit In A High Volatility Market – Tradeciety
