Moving Averages are popular technical indicators that try to estimate the average price of an asset in a certain period. For example, if a stock is trading at $50 and its 20-day moving average is $100, it means that the stock recently rose sharply above where it has been in this period. Therefore, in theory, it can be said that the stock is overvalued.
There are many variations of MAs; In this article, we will look at what the Hull Moving Average (HMA) is and how you can use it in day trading to reduce the lag.
What is the Hull Moving Average?
As mentioned, a moving average refers to the average price of a currency pair or any other asset in a certain period. This average is calculated by simply adding the asset’s price and dividing it by the number of days. This is known as a simple moving average because it takes all the periods equally.
The simple moving average is the most popular type of moving average. However, many statisticians believe that it is usually not accurate because it usually takes all periods equally.
Therefore, to remove this challenge, some calculation methods have been proposed. For example, the exponential moving average (EMA) reduces the lag by providing more weight to recent data.
The Hull Moving Average was developed by Alan Hull to solve this challenge too. It is a relatively new concept since Alan developed it in 2005. The goal of this directional trend indicator is to make it more responsive to the current price activity while at the same time maintaining the smoothness of the curve.
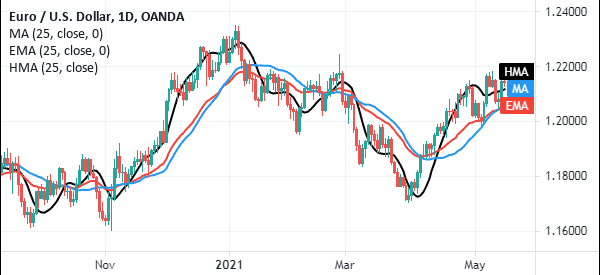
The daily chart below shows a 25 HMA in black and a 25-day EMA and 25-day SMA. As you can see, the HMA is more responsive to the asset price change than other types of moving averages.
HMA calculation
The HMA indicator is calculated in a relatively long process since you first need to calculate the weight moving average of an asset’s price. You can use the link to find how the WMA is calculated.
To get the HMA, you first need to calculate two weighted moving average of the asset. One should have a specified number of periods and one should have the half of that period.
| WMA1 = WMA (n/2) |———| WMA2 = WMA (n) |
After this, calculate the raw Hull Moving Average. This is a line that is not yet smoothed. You do it by using the following formula:
| Raw HMA = (2 X WMA1) – WMA2 |
Finally, smooth the raw HMA with the WMA, using the formula below:
| HMA = WMA (sqrt (n)) of Raw HMA |
Therefore, as a normal day trader, you can see that this is a long process. Good thing is that you don’t need to do it since it is already provided by most trading platforms.
Best settings for the Hull Moving Average
As with most technical indicators, you need to have the right settings for it to work. In the case of HMA and other MAs, you need to have the right period.
By default, the HMA comes with a period of 14. However, you can easily tweak this to meet your trading needs and strategy. To get the right period, it is recommended that you spend a few times in a demo account to see the one that works well for you. We suggest to use 15, 25, and 50 as periods when trading.
Hull moving average trading strategies
So… how to use it? Well.. The HMA indicator is used in a similar way to other moving averages! Here are some strategies where this tool can prove to be really very useful.
HMA in trend following
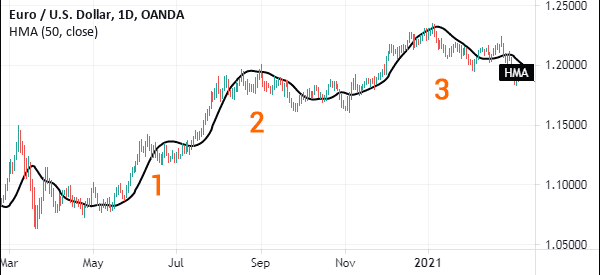
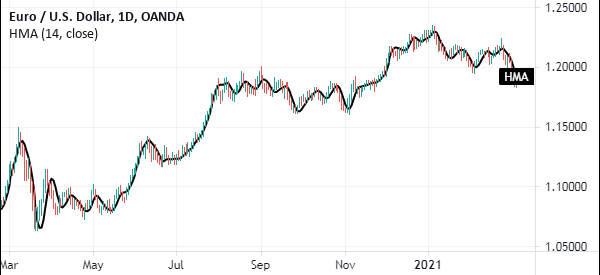
First, you can use the indicator in the trend following. The idea is to identify the right period of the indicator and find an asset whose price is rising or falling. In case of a rising asset’s price, your goal is to ensure that the HMA is below the price. A sell-trigger emerges when the price moves below this moving average.
A good example of this is shown in the chart below. As you can see, the price kept rising when the HMA was below the price.
Hull MA to identify crossovers
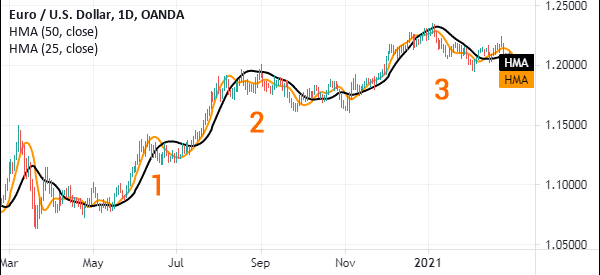
The second strategy for trading using the HMA is to identify crossovers. This is an idea that works for many traders, but one that Alan Hull discouraged. Usually, traders use the strategy by taking a 50-day HMA and a 25-HMA, After this, the goal is to identify where the two make a crossover.
For example, in the chart below, we see that a bull trend started when the two averages made a crossover at 1, 2, and 3. However, we can also see that at certain periods, the crossovers did not produce a major new trend.
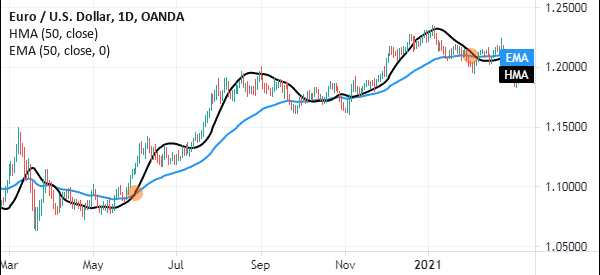
The third approach is that of combining the HMA with another type of moving average of equal length. In this case, you can combine the 50-day HMA and a 50-day EMA, with the goal of identifying potential crossovers.
HMA indicator for day trading: Pros and cons of the
There are several benefits and advantages of using the Hull Moving Average indicator. First, it is a relatively easy-to-use indicator just like other MAs. Second, unlike other types of MAs, it reduces the lag. Third, it can be used to analyze all types of assets like ETFs and stocks. Finally, it is provided by most trading platforms like the MT4 and TradingView.
On the other hand, there are a few cons. Some users say that reducing the lag makes it not an effective moving average. For example, in the chart below, we see that the indicator does not give a clear entry and exit signal. Second, calculating it is a relatively difficult process.
Summary
The Hull Moving Average was developed by Alan Hull in his attempt to reduce the lag that exists in other types of assets. While the indicator works well, it does not provide accurate signals like other types of moving averages like the Weighted Moving Average (WMA) and Exponential Moving Averages (EMA).
Have you had a chance to try the HMA yet, or has our guide given you an extra tool for your technical analysis?
External Useful Resources
- Reducing Lag in Data: The Hull Moving Average as a Trend Reversal Indicator – Medium.com
