On a single day, millions of people from around the world struggle to make decisions about financial assets. Their struggle is on how to predict the direction in which the securities will move.
When their price moves higher, they profit by buying the securities. If they believe that the price of the securities will move lower, they sell short.
To do all this, the traders use a number of strategies. One of the most famous is to analyze a chart using Elliott Waves.
Trader’s Analysis: Fundamental & Technical
The first common strategy is on fundamental analysis. In this, they consider the relevant news and how they will impact the market. For example, if the Federal Reserve releases a dovish statement, they sell the dollars and vice versa.
The other common strategy is on technical analysis. In it, the traders use one or a combination of the technical indicators that are provided by the brokers.
There are thousands of trading strategies in the financial market. Some of the most common trading strategies are:
- hedging
- scalping
- support and resistance
- moving averages
- Fibonacci retracement
- horizontal levels
among others. As a trader, your goal is to understand 2 or 3 strategies and use them for your daily trading. In addition, you can always define your trading strategy that suits your trading patterns.
Related » 7 and more endless day trading strategies you should know
What is the Elliott’s Wave Strategy
The Elliott’s trading system was accidentally established by Ralph Elliott who decided to study market behaviour in his later stages in life. After spending time learning and analysing the markets, Elliott came up with the book, ‘The Wave Principle’ where he published his opinions.
As an accountant, Elliott believed he had a role to play in the financial market but he did not discover it after retiring at age 58.
Today, his theorem is one of the most commonly used trading strategies. In most cases, traders combine the strategy with many other strategies such as moving averages, Fibonacci, stochastic, and support and resistance among others.
The Origins of the Theory
In his analysis, Elliott analysed stock prices of more than 70 years and discovered that the market moved as a result of psychology.
For a large extent, the market moved as a result of fear and greed among the participants. In addition, Elliott noted that the market did not move in a chaotic manner but in an iterative manner. He also noted that group psychology moves back and forth from optimism to pessimism at diverse levels.
As a result, during times when the market is in a strong uptrend, there are times when the mood changes and traders begin to sell. On the other hand, when the market is in a strong downward trend, a time reaches when the traders moods changes and exits the trade.
Related » 7 Emotions that can Destroy your Dream
How to Trade the Elliott Wave
In the Elliott’s Wave Strategy (EWS), the key idea is to understand the market psychology which indicates the swing between optimistic and pessimistic modes. At times, the market instruments will be bullish and, at times, they will be bearish.
When the market is in a bullish state, the traders and investors will have an appetite for making more money and go long.
After some time, the buyer’s remorse sets in and the traders dump some of their holdings. At this time, the market is in a correction phase.
Related » How to Know When a Market Correction is Approaching
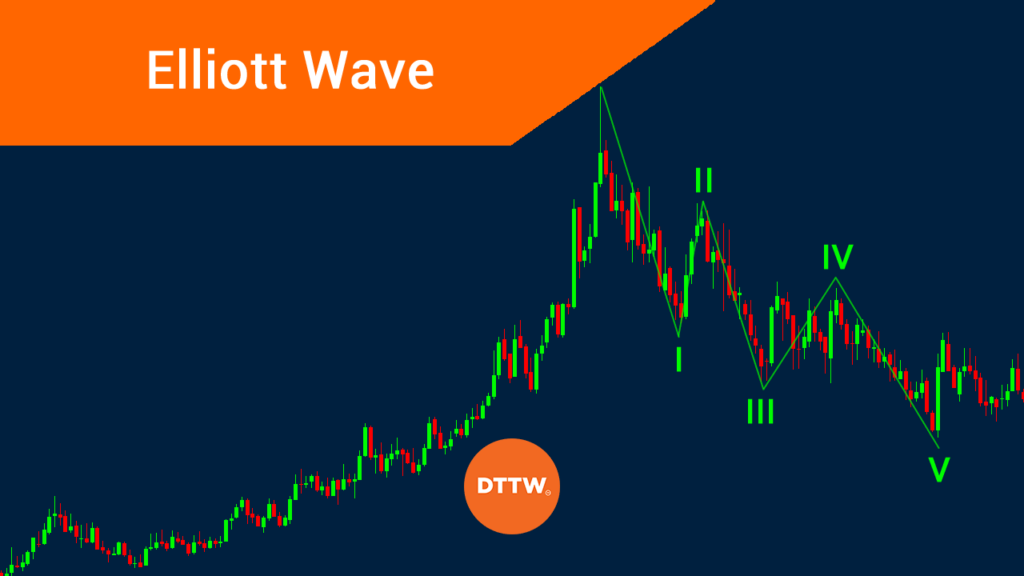
The motive phase according to the EWS takes 5 steps which are shown in the chart below.
The 5 steps of the Elliott Wave
In this chart, a number of things can be seen. At the beginning of the wave, the longs have an appetite for taking more risks which leads to a price hike.
Related » Knowing Your Risk-Reward Ratio
In the second wave (2), emotion sets in and traders dump some assets which reduces the price of the pair. This is a phase where correction happens which results from human emotion.
In the 3rd phase, the traders decide to continue the Bull Run which sends the prices higher.
In the next phase, the forth (4), the second correction happens and aims to retrace the wave. Traders sell the instrument.
In the fifth wave, the price finally settles up near the highest point of the pattern. However, this is usually not the end of the wave. By expanding the chart, the following pattern will be seen.
In addition, the Elliott wave is not only limited to a bullish chart. The correction will also happen in a strongly bearish market where investors are selling certain instruments. As stated above, the key to understand a trend is to identify the trend.
The Rules Explained
There are several rules that govern the Elliott Wave strategy.
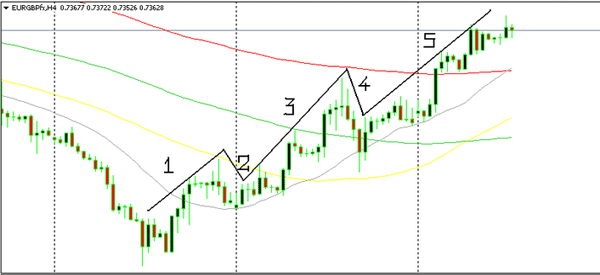
- The first one is about where the first wave starts, as shown above. Ideally, when drawing the initial wave, it should start at a significant lower level. Typically, it starts after the financial asset reaches a key lower point.
- The second rule is about the second wave. According to Ralph Elliot, the price of an asset should not retrace completely the first wave. The same is true with the fourth and fifth waves.
- Further, another important rule is that the third wave should never be the shortest. Indeed, it is usually the longest of the five waves in most cases.
The general idea of Elliott Wave is relatively simple. It starts when the price of an asset starts to rise, attracting some buyers. As the price rises, it finds some sellers, who pushes it lower. At this point, some buyers start to exit their trades.
In the next third phase, more buyers come in and push the price higher. The fourth phase forms when some buyers start selling. In the final stage, buyers return and push the price higher.
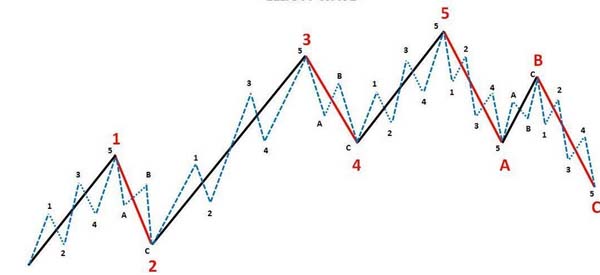
After the impulse wave, the price then goes through a corrective phase that is usually in three stages; A, B, and C.
Elliott Wave in forex example
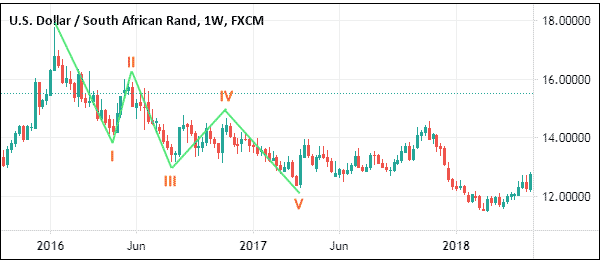
You can use the Elliott wave across the various asset classes, including stocks, forex, indices, and shares. The most popular one is usually in the forex market. A good example of this is shown in the USD/ZAR chart below.
As you can see, the Eliot wave formation can happen when the currency pair is rising and falling.
How the Elliot Wave works
The Elliot Wave pattern works in a relatively simple way. As mentioned below, there are five waves that usually happen within a short or a long period.
The wave can be clear in all chart periods starting from a minute to a monthly chart. This is why it is important that traders take time to do a multi-timeframe analysis.
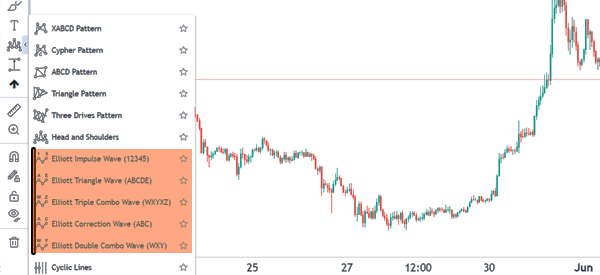
The Elliot wave starts with an impulse wave, which is a five-step pattern. It then ends with a three-wave pattern known as a corrective wave. The chart below shows where you can find the Elliot wave drawing tools in TradingView.
Impulse and correction wave
The two most important parts of the Elliot wave are impulse and corrective waves.
An impulse wave is a five-wave period that happens during a bull market. The impulse starts when an asset’s price starts rising and it forms the first part of the wave. After a certain period, the price makes a small pullback.
The third part of the impulse wave is the longest. It is a bullish period when the asset price continues rising. In the fourth part, it makes a small pullback. Finally, in the final part, the price starts rises again.
An impulse wave completes when all these parts happen. As mentioned above, there are rules that govern these cycles.
It is also worth noting that the opposite can also happen. At times, the start of a bearish impulse wave can start on top.
The correction wave is usually a three-part section that happens after the impulse wave. It usually has three key parts that are usually stated as ABC and 123.
Let’s bring up again the image we showed you above to fix the concept again.
Eliot Wave Degree
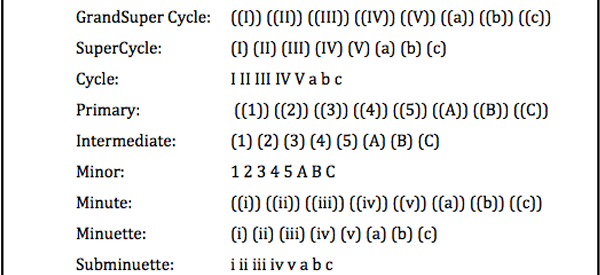
Another important concept in Elliot Wave is known as degree. The idea of an Elliot Wave degree is based on the fact that there are usually smaller waves within the bigger wave.
These waves are usually divided into a grand supercycle, supercycle, cycle, primary, intermediate, minor, minute, minuette, and subminuette as shown below.
Key Take Away
In conclusion, it is very important to note that using this strategy is not as simple as explained above. The fact is that it takes a lot of work, patience, and time to learn the strategy.
If the strategy does not fit you, the best thing is to find another strategy that is simple and easy to understand for you.
External useful resources
- EWS for Forex Trading – ForexTradingStrategies
