The market is usually mostly driven by fear and greed, which are generally some of the most important emotions.
It is greed that pushes people to buy an asset they don’t understand just because its price is rising. Similarly, it is fear that makes many people stay out of the market or sell their holdings when key issues.
Let us look at some examples.
Examples of fear in the market
There are many times when there has been an overall fear in the financial market. First, in early 2,000s, global stocks crashed when the dot com bubble burst. That pushed the Dow Jones, Nasdaq, and S&P 500 index down by double digits.
Ideally, traders were afraid that the overall stock market would continue underperforming.
Second, between 2008 and 2009, the financial market went south after the real estate market bubble burst. That happened as more people struggled to pay back their subprime mortgages.
At this point, you may also find it useful to know whether or not we are in a stock market bubble.
Third, in the first quarter of 2020, global stocks dropped sharply after the World Health Organisation (WHO) declared the novel coronavirus a global pandemic.
At the time, most traders believed that the impact would be significantly worse (but they could still take advantage of the very high volatility).
Other causes of fear in the market are geopolitical tensions, political events, and interest rates. They can also happen in individual assets. For example, in 2020, the price of crude oil slipped below $0 as traders worried about demand and oversupply.
Related » What is panic selling
Examples of greed in the market
In the past few years, greed has been an easy thing to see in the market. For example, in the late 1990s and early 2000s, most people rushed to buy any companies that had a dot com suffix.
Similarly, before the Global Financial Crisis, investors rushed to buy banks because of their success in boosting their mortgage businesses.
The most important example of when greed dominated the market was in 2017 when the price of Bitcoin first surged to $19,000. At the time, people from around the world were rushing to invest in cryptocurrencies that they had no understanding about.
Related » How to Know You Are Being Too Greedy
Fear and greed index
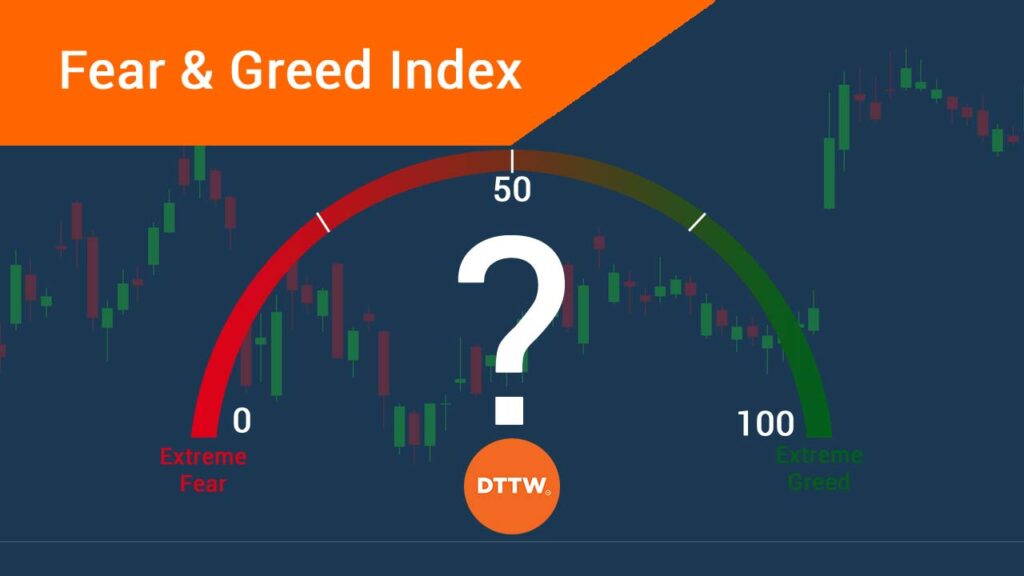
The fear and greed index is a sentiment tool that is used to gauge the situation in the market. It was developed by CNN Money, which is the finance arm of CNN. The index uses several sub-indexes to predict whether the market is extremely fearful or greedy.
As a result, financial market participants use this information to know what to do with it. The index ranges between zero and 100. When it is zero the market is usually extremely fearful while when it is at 100, the market is said to be extremely greed.
Sub-indexes
The index is developed by looking at several other sub-indices, which include:
- Stock price Strength– This sub-index looks at the companies in the S&P 500 that are hitting their 52-week highs and lows.
- Stock price breadth – This index uses the McClellan Volume Summation Index, which looks at the advancing and declining volume in the NYSE.
- Market momentum – This uses the 125-day moving average. If the S&P 500 is above this MA, it means that the momentum is gaining steam.
- Market volatility – This index looks at the CBOE volatility index to predict whether there is volatility in the market.
- Put and call options – The put and call options can help you predict where traders are placing their bets.
- Junk bond demand – The final part of the fear and greed index is the junk bond demand. When there is extreme fear, investors tend to move away from junk bonds. Similarly, when there’s extreme greed, they usually move to junk bonds.
- Safe Haven Demand – Safe-haven demand looks at the performance of stocks and bonds since the latter are seen as being safer than stocks.
Calculation and data availability
The fear and greed index is calculated by looking at the seven indicators mentioned above. In this case, the indicator provides a different weight for each of them. It then looks at how much these indices deviates from their average.
For example, it looks at how the CBOE volatility moves above the 50-day moving average. On safe haven demand, it looks at the difference in 20-day stock and bond return since stocks are riskier than bonds but reward for investing in stocks in the long-term is stronger.
On the stock price strength, it looks at the net new 52-weel highs and lows on the NYSE.
Example of the fear and greed index
The chart below shows the fear and greed index at work. As you can see, the index dropped to a multi-year low in the first quarter of 2020 when the market was worried about the global economy. It then rallied to almost 100 when the period of exuberance returned to the market.
This happened as global stocks rallied and as the main indices started to hit new highs.
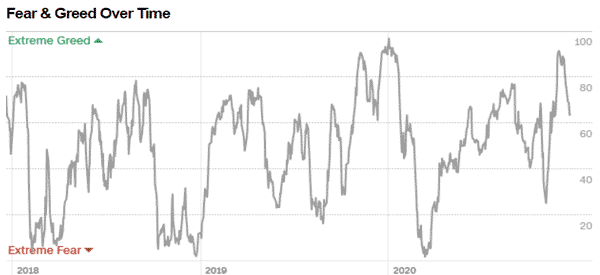
Before the Covid pandemic, we see that the index moved to extreme fear two times in 2018. As you recall, this happened as tensions between the United States and China continued to rise. At the time, investors believed that the trade war would have significant impacts on the economy and corporate profits.
The index reached extreme greed in late 2019 and early 2020 as the two sides reached a preliminary deal.
How to use the fear and greed index
The fear and greed index is not a typical indicator. It is not like the moving averages, relative strength index, and other indicators. It cannot tell you when to buy an asset or not. For one, it is usually mostly effective when looking at the S&P 500 index and other indices.
However, you can still use the index to gauge the overall performance of the market. For example, when the index is at extremely greed levels, it can send a signal to short the S&P 500. At the same time, when it is at the greed zone, it can tell you to keep buying as you wait for the extreme levels.
Similarly, when it is at the fear level, the index can tell you to continue shorting the S&P 500. As it reaches the extreme fear level, it can tell you to buy the index.
Pros and cons of fear and greed index
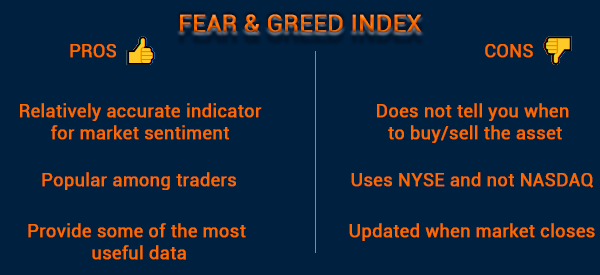
There are several pros and cons of using the fear and greed index. Some of the pros are:
- It is a relatively accurate indicator when reading market sentiment.
- It is a popular indicator among traders and investors.
- It compiles some of the most useful data in the market.
On the other hand, the index has some notable cons:
- It does not tell traders when to buy or sell an asset.
- It is updated when the market closes.
- Its stock price strength uses the NYSE and not Nasdaq.
How the fear and greed index affects decisions
The fear and greed index is mostly used to gauge the overall market conditions. For example, if the index is falling, it is a sign that investors are getting fearful. It could be a sign that there are underlying risks in the market, meaning that a trader can buy safe-havens like the US dollar and gold.
On the other hand, when it moves to the greed level, it could be a sign that that risky assets like cryptocurrencies and technology stocks are doing well. When it moves to the extreme greed level, it is a sign that top assets will retreat.
How to avoid fear and greed
It is relatively easy to avoid fear and greed in the market. Some of these strategies are:
- Doing your research well before you open and close a trade.
- Have a trading journal, which is a document that lists your trading decisions.
- Set a stop-loss and take-profit for each trade.
- Be patient on all your trades.
- Have a trading plan.
- Always prepare for the best and expect the worst.
Final thoughts
The fear and greed index is an important tool used in the financial market to gauge the performance of the financial market. The index can be used to predict whether to buy or short the S&P 500 and other indices.
As such, it can only be used by swing traders and other long-term or position traders.
And you? Have you ever approached the Fear and Greed Index? Do you have other considerations on this? Let us know in the comments!
External Useful Resources
- Fear & Greed Index live data – Money.CNN.Com
- How the Index Can Guide Your Investing – TheBalance
