As a trader, you will meet many new concepts on a regular basis. You will often find traders who only believe in the concept of technical analysis and others who believe in the concept of fundamental analysis.
You will meet those who believe in swing trading and others who believe in day trading (See also Day Trading vs Swing Trading).
While each of these traders have different views on the market, there is one concept that has proven to be very valuable. This concept is known as Fibonacci Retracement, developed using the ideas of the Fibonacci sequence, which can be traced to more than a century.
The fibonacci sequence in Day Trading
In the Fibonacci sequence, each number is a sum of the two numbers that precede it. As such, the sequence goes like this: 0, 1, 1, 2, 3, 5, 8…
The overall formula is: Xn+2= Xn+1 + Xn.
By tweaking this formula, the Fibonacci retracement tool can be used in the markets to help in decision making to identify pivot points or areas that the price is likely to move to. This is more so useful in a trending market.
To use it, you don’t need to have any knowledge on how the Fibonacci sequence works.
→ You can check this small calculator for Levels
How the Retracement works
The Fibonacci retracement tool is offered by all popular trading software like the TradingView and MetaTrader. The chart below shows how you can find the Fibonacci retracement in TradingView.
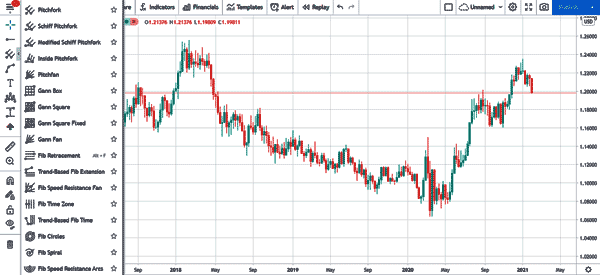
The first step is to visually look at a chart and see whether it is trending. A trending market is one which is moving in an upward or downward direction. If the price is ranging, it means that it is almost impossible to apply the Fibonacci tool.
Second, if the price is ranging, you need to identify areas where it is making swing highs and swing lows. After this, you need to drag the Fibonacci Retracement tool. This will result to a number of lines, which are all indicated by percentages (levels).
After joining these lines, each of the Retracement line will become a point to watch in your trading.
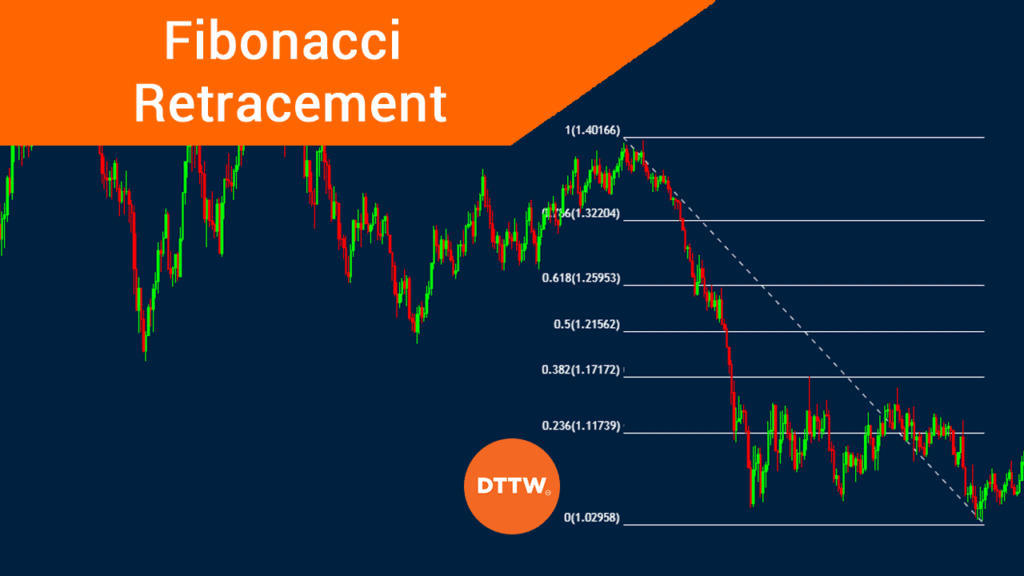
For example the GBP/USD pair is in a downtrend and the price has moved to the 61.8% Fibonacci Retracement level. The implication is that the next support level will be along the 50% Fibonacci Retracement level of 1.2900.
At this level, the pair will likely find resistance as traders decide on what next. It could also come back to the 61.8% level and then continue moving lower.
What is the Fibonacci Retracement Golden Ratio?
One of the important parts of the Fibonacci Retracement is known as the golden ratio. This ratio is 1.618 since all any number in the sequence divided by the previous number gives 1.618%.
For example, 38.2/23.6 is 1.68 and the same is true for 78.6/6. The 38.25 ratio, on the other hand, is calculating by dividing one number in the series by the number two places to the right.
What is Fibonacci extension?
As the name suggests, the Fibonacci retracement looks at the key points inside a chart. As We explained above, the retracement is drawn by connecting the highest and lowest points of a chart. Therefore, the Fibonacci extension hopes to get the levels above these points.
For example, if the upper and lower sides of a chart is $10 and $5, the Fibonacci extension levels could show the next targets at $13 and $15. The most popular Fibonacci extension levels to watch are 161.8%, 200%, and 261.8%.
Fibonacci extension is important since it show where the asset will move to once it move above the 100% retracement point.
How to use the Fibonacci retracement tool
The process of using the Fibonacci is relatively simple. First, you need to look at the chart and identify key levels. Ideally, you want to look at the highest and lowest swings. The asset’s current price should never be the highest or lowest points.
Second, you should select the Fibonacci retracement tool as mentioned above. Finally, you should join the highest and lowest points, as shown below.
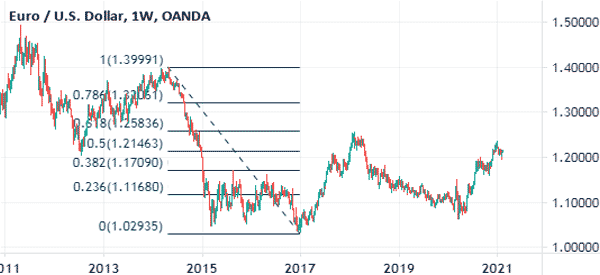
In the weekly chart shown above, we have joined the highest point in March 2014 with the lowest level in march 2020.
As you can see, the price started rising in January 2017 and then found some resistance at the 23.6% Fibonacci retracement level. It then continued rising and found resistance at the 38.2% Fib level. It then hit resistance at the 50% and 61.8% level. By that time, the pair managed to reverse.
To use the Fibonacci retracement tool well, you should mark the key levels well. In most cases, the price will always find resistance when it hits the noted retracement levels.
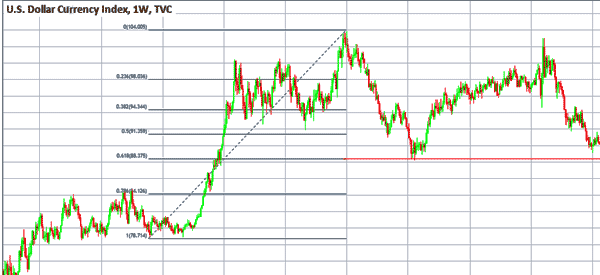
The chart below is another example of the tool in use. Note that the price of the dollar index managed to recover after hitting the 61.8% retracement level.
Fibonacci’s Best Practices
The best practice for using the Fibonacci Retracement is to focus on the long-term chart. In most periods, you should start by drawing the retracement on the weekly chart and identify the key levels.
You should then move to the daily chart and note the retracement levels. Further, you should then move down to the intraday levels.
Related » A Guide to Multi Time Frame Analysis in Trading
The retracement is not always accurate. This means that it does not always lead to positive guidelines. Instead, the tool is best-used by combining it with other indicators.
Examples of other indicators that are commonly used with it are moving averages, Bollinger Bands, and Parabolic SAR. These are trend indicators, which are used in determining the direction of the asset.
Others are:
- Relative Strength Index
- Relative Vigor Index
- Stochastic
- Bulls and Bears Power
These oscillators are very common because they give an indication when an asset is overbought or oversold.
When is it best to use the Fibonacci Retracement?
There are certain conditions that are mostly common when using the Fibonacci Retracement. For example, it does not make sense to use the Fibonacci Retracement point when an asset is ranging. It is also not recommended to use the retracement when an asset is highly volatile.
Instead, you should use it when an asset is trending up or down. A good example of this is shown in the chart below.
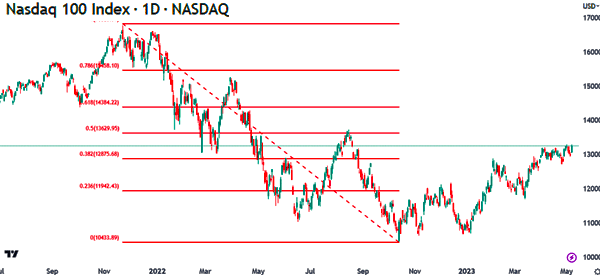
When will the retracement become invalid
The Fibonacci Retracement usually becomes invalid when the price moves above or below the 0% and 100% levels.
When this happens, investors should focus on the Fibonacci extension levels, which appear above these levels.
Summary
The Fibonacci retracement tool is one of the must-use tools in day trading. It is used to identify reversal and extension points. While the Fibonacci sequence is a bit difficult, the tool itself is relatively easy to use.
We provide the chance to Draw Fibonacci Retracement in Charts in our Trading Software, PPro8.
External useful resources about Fibonacci Retracement Tool in Trading
- How to Use Fibonacci Retracement with Support and Resistance – Babypips
- Discover more on TimothySykes
