Ulcers is one of the most common and uncomfortable illnesses you can ever have. The disease happens when a thick layer of mucus that protects your stomach is reduced.
The Ulcer Index (UI), which is not a popular trading indicator, was created based on the idea of stomach ulcers.
The indicator was created by Peter Martin and Byron McCann, who introduced it in their book, The investor’s guide to fidelity funds. The book was released in 1989 and was targeted towards mutual funds traders.
In this report, we will look at what the ulcer’s index is, how it is calculated, and how you can use it in the markets.
What is the ulcer’s index?
Ulcer’s index is an indicator that helps traders measure the drawdown market participants are expected to stomach on any security.
While the index was created with mutual funds in mind, it is now used by traders in all asset classes including currencies, stocks, commodities, and indexes.
To some extent, the index is similar to the standard deviation.
How it is calculated
The ulcer’s index is calculated based on closing prices of a financial asset. Since the index measures volatility based on price depreciation, the index will be zero when the price of an asset increases during each period.
However, this is not possible because prices of an asset tend to move up and down even when the price is moving on an upward trend.
The index is calculated using the following method:
| Percent-drawdown = ((Close – 21-period max close) / 21-period max close Squared average = (21-period sum of percent drawdown squared) / 21 Ulcer index = square root of squared average |
Let us mentioned two things.
First, as we have mentioned in our past articles, while knowing how to calculate an indicator is a good thing, it is not necessary. We know many great traders who can’t calculate even the simplest indicators like moving averages.
Second, when calculating, you can change the period to suit your trading strategy.
How to Use the Ulcer’s Performance Index in Charts
Using the Ulcer’s index is not difficult. First, you need to find out whether your charting platform has it built-in. This is because most platforms like the MT4 does not have Ulcer’s index have it installed. Instead, you have to download and install it directly.
Second, you need to look at the settings of the indicator and check the period. The default period on most platforms is 14 but you can tweak it depending on your strategy.
You will see two lines when you launch the app. One of the lines will have two colours while the other one will be a continuous line. This is usually the signal of the indicator.
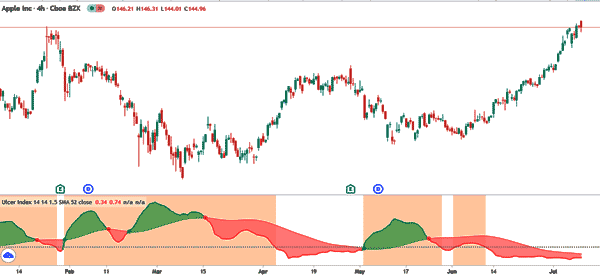
Finally, unlike other indicators, the Ulcer index is only suited when the financial asset is moving upwards. In this, the two lines will hover around the centreline.
It is also worth noting that the Ulcer’s index is not recommended for all types of day traders. It is only ideal for long-only traders. This is because the price will typically hover near zero when the price is reaching its record highs.
The chart below shows that the index declined as the Apple stock rose to its highs.
Example of Ulcer’s Index
The chart below shows an example of the Ulcer’s index used on another Apple chart.
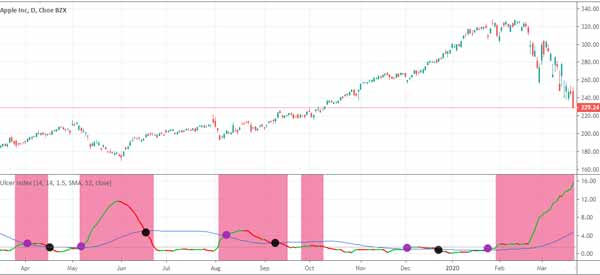
As you can see, the two lines of the Ulcer’s index oscillated around the centreline when the price was moving in an upward trend. The green line then rose sharply when the price dropped significantly.
On the chart, you can see the purple and black circles. The black circle represents the crossunder while the purple circle represents the crossover. As with all indicators with two lines, you should always focus closely on these crossovers because they tend to say something.
Ulcer Index and Standard Deviation
The Ulcer Index is often used as an alternative to the standard deviation. This is because the standard deviation accounts for both upside and downside volatility.
As such, investors or traders long an asset are mostly focused on the downward volatility. To account for this movement, the Ulcer index has the Ulcer Performance Index, which is the total returns less the risk-free return divided by the ulcer index.
Another difference between the two is how they are calculated. The standard deviation indicator is calculated in a number of steps. First, you find the average closing price of the asset. Second, you find the deviation for each period followed by the square deviations. Next, you obtain the sum by the number of deviations and calculate the standard deviation.
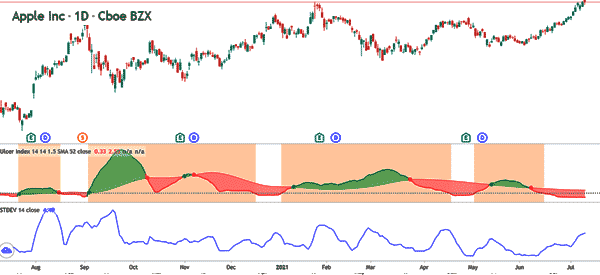
The chart below shows the Ulcer index and the standard deviation applied on the Apple chart.
Why Use this indicator in you Trading Activity?
Ulcer’s index is not a popular indicator. In fact, you will not find it in most trading platforms.
Still, there are several reasons you may consider using it:
- It is an indicator that is very simple to use.
- The signals it shows are relatively easy to understand.
- The indicator is rare, which means that it can show you signals that other traders have not seen yet.
Summary
Ulcer’s index is an excellent indicator that you can use to identify trading opportunities. However, like in all other indicators, you need to take time and learn about it. You also need to practice a lot to define a strategy that you will be using.
External Useful Resources
- Ulcer Index and UPI Measure Investment Risk and Risk-Adjusted Performance – Tangotools
- More info about Ulcer Charts – Stockcharts
