An iceberg order is one that is often made by big institutional investors to “hide” what they are buying and selling. It is a relatively popular type of order that ordinary traders can use to make decisions on whether to buy or sell a stock.
In this article, we will look at what an iceberg order is and how you can take advantage of it.
What is an iceberg order?
In general, the stock market is usually driven by demand and supply. This simply means that stock prices tends to react to the amount of demand and supply in the market. If there is too much supply, the stock will tend to decline and if there is too much demand, the stock will tend to rise.
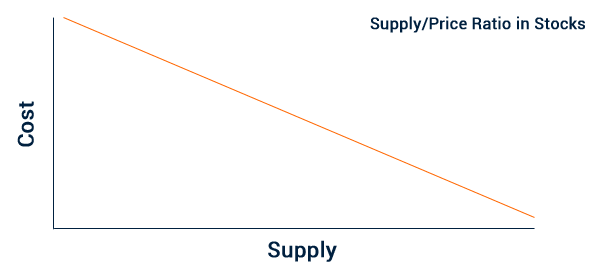
Therefore, at times, large institutional investors who buy stocks in their billions can distort the market. For example, if you are buying more than 2 billion shares of a company, there is a possibility that many people will see this action and push the price higher.
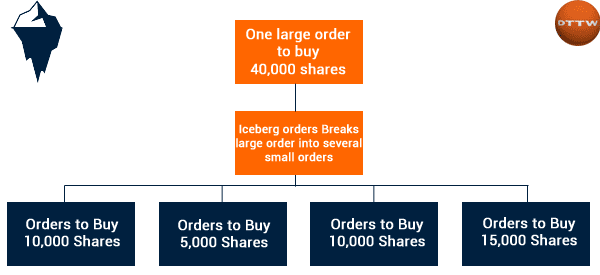
Therefore, an iceberg order solves this by breaking down an order into several chunks over some time. For example, if the stock is trading at $25, the investor could place several chunks of orders over time. By so doing, people who focus on order flow will not be able to spot the real orders that are happening.
An iceberg order is usually called so because of the notion of a tip of an iceberg. This is where you see a small part of the iceberg without seeing the big ice underneath the waters.
Therefore, for an ordinary trader with a few thousands dollar account, it is almost impossible to trade using the iceberg order. This is because their order sizes are relatively small and unlikely to have a major impact on an asset. The only place where this is possible is in small companies that are also known as penny stocks.
The chart below simplifies how an iceberg order looks like.
How to identify iceberg orders using Level 2 data
To understand iceberg trading, it is important to understand the concept of level 2 order book. You can learn more about level 2 in our comprehensive guide.
Level 2 is data provided by some brokers that show you the trends in the market. It provides details about the bid and ask prices. Some brokers provide between 10 and 15 prices of the highest bids and lowest offers. They compile this data automatically from market makers.
Level 2 differs from level 1 data because it is usually relatively more comprehensive. It also provides more data that can be useful when making investment decision.
When looking at iceberg orders, it is important that you look at level 2 data because they will help you spot them.
How to trade using iceberg orders
As mentioned, iceberg order types are mostly placed by large institutional investors who want to hide what they are doing from other investors. These investors will mostly break down their orders into several chunks. Indeed, this is the main reason why many hedge funds typically don’t have a single entry price for a stock. In most times, you will hear them describe their entry point in form of the average price paid.
Therefore, for an ordinary trader, there are several strategies you could use to identify when an iceberg order is being placed.
The most popular one is using level 2 data to identify bid and ask prices of an asset. In this case, you should incorporate this data reading in your trading strategy.
By this, you should spend time looking at the patterns involved. For example, you could spot several orders of equal or different sizes. Also, you should look at several big orders in the Level 2 tool. If you see several prints repeated, there is a high probability that it is an iceberg order. In these cases, day traders can keep an eye on the volume of shares to try to understand when one of these orders is placed.
You should take time to identify the pattern involved.
Example of an iceberg order
An iceberg order can work like this. The share price of a company is trading at $20 and you are a large investor who wants to buy shares worth $1 billion. In this, you could ask your broker to open 50 orders, each worth 20,000 shares. When you do that, you will have implemented an iceberg order.
And since the price is often moving, at the end, there is a possibility that the average order price will be less or above $20.
Summary
An iceberg order is one where you break it down into several small chunks. By so doing, you will be keeping the price stable as you do the purchase. As a trader, you can use this information as part of your research process.
External Useful Resources
- Hiding (and Seeking) With Iceberg Orders – Exegy Signum
