The Ichimoku Kinko Hyo is one of the most controversial technical indicators. Why? Its look makes many traders avoid it! In reality, it is one of the most useful indicators.
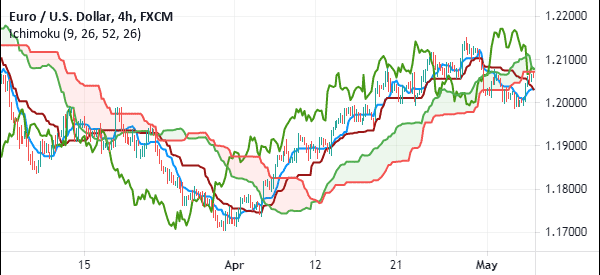
Most professionals use it to identify key support and resistance levels, identify trend direction and its strength, gauge its momentum, and provide actionable signals. The indicator was suggested by a Japanese journalist, Goichi Hosoda. The chart below shows how the Ichimoku Kinko Hyo looks like
What is the Ichimoku Kinko Hyo Indicator
The Ichimoku Kinko Hyo is an indicator that has five main parts. Below, we look at these five parts and how they are calculated. These are:
- Tenkan-Sen – This line is also known as the conversion line. It is calculated by adding the period high and period low and dividing it by two. In most platforms, the default period is 9. In the chart below, the Tenkan sen is shown in red.
- Kijun-sen – This line is also known as the standard line. It is calculated by adding the highest high with the lowest low in the past 26 days divided by two. As with the conversion line, the period can be tweaked. The Kijun Sen is shown in blue in the chart below.
- Senkou span A – This is also known as leading span A. This is calculated by adding the Tenkan-Sen and the Kijun-sen. You then divide by two.
- Senkou span B – This is also known as the leading span B. It is calculated by adding the highest high and highest low in the past 52 days divided by 2.
- Chikou span – This is also known as the lagging span. This is the current period’s closing price plotted 26 days back. In the chart below, the Chikou span is shown in lime.
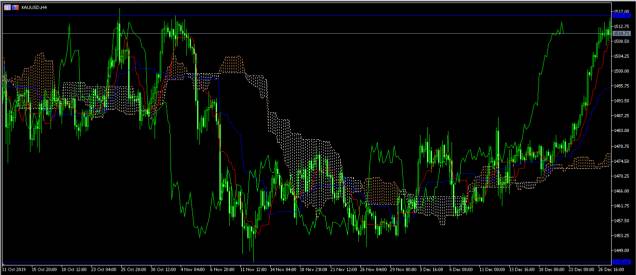
The chart below shows the Ichimoku Kinko Hyo applied on the four-hour XAU/USD pair. The white and orange levels are known as the Ichimoku cloud.
Analyze Trends with the Ichimoku Cloud
Traders use the Ichimoku Kinko Hyo in a number of ways. First, they use it to confirm a trend. If the price is above or below the cloud as shown above, it is usually a sign that the trend will continue.
A reversal of the trend is usually signalled when the price enters the orange cloud.
The second way they use the indicator is to confirm the trend strength and weakness. In an uptrend, when the Chikou Span (shown in green in the chart above) is on the left side, it is usually a signal that the upward trend is strong.
In a downtrend, if the line is on the left of the price, it is usually a signal of a strong downward trend.
Ichimoku Trading Strategies
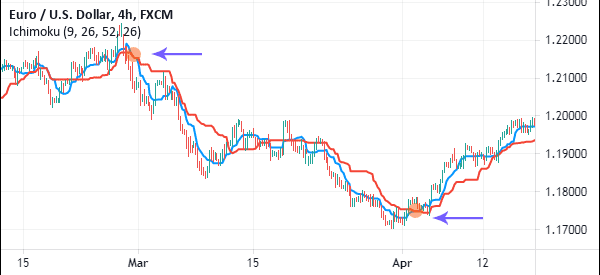
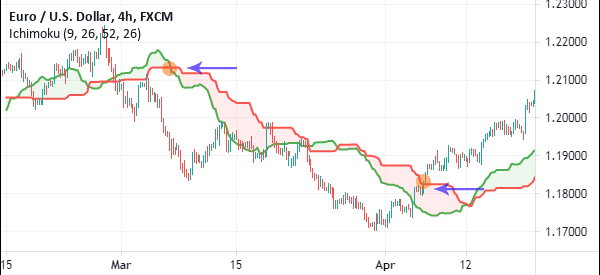
There are other ways of interpreting the indicator. For example, when the Kijun-Sen and Tenkan-Sen makes a crossover, with the price moving upwards, it is usually a signal that the upward trend will continue.
Ichimoku crossover
Crossovers are important signals when using indicators. In the past, we have looked at several types of crossovers like the golden cross and death cross. The two refers to a situation where the 50-day and 200-day moving averages crossover. We have also looked at crossovers of Stochastic and MACD indicator.
It is possible to use the Ichimoku cloud using crossovers. To use this strategy, an asset’s price needs to be moving in an ascending or descending direction. It cannot be used during a period of consolidation.
To use it well, you need to disable most sections of the Ichimoku kinko Hyo and leave the base line and the conversion.
When the two lines cross facing upwards, it can be a sign that the price is about to start a new bullish trend. Similarly, if the two makes a crossover when the price is facing downwards, it could be a sign that a new bearish trend is about to start.
A good example is shown below. In it, the blue line is the conversion line while the red line is the base line.
Kinko Hyo in Trend Following
You can also use the base line and the conversion lines in trend following. For starters, this is a strategy where you identify an existing trend and follow it. When the price is rising, you should ensure that it remains above the baseline. If it moves below this line, it is a sign that the trend is starting to wane.
Similarly, when the price is falling, you should watch out for the baseline. If it crosses it, it is a signal that a reversal is about to happen and that you should start to exit.
Using the Ichimoku cloud
Another trading strategy of using the Ichimoku Kinko Hyo is to disable all parts except lead 1 and lead 2 and their backgrounds. When a currency pair or any other asset is starting to rise, you should only place a buy trade when it moves above the Ichimoku cloud. Similarly, when it is falling, you should only short it when it falls below the cloud.
A good example of this is shown in the chart below.
Key Take-Away
As a trader, there are several things you need to know about Ichimoku Kinko Hyo. First, you don’t need to know how to calculate the indicator. This is true with other indicators too. Second, you need to test the various periods to see the one that works for you. Finally, it is recommended that you combine the indicator with other indicators.
Most importantly, while the Ichimoku Cloud looks like a complicated indicator, it is also one of the easiest to use.
External Useful Resources
- History of Ichimoku – Slideshare
- Ichimoku Clouds on Stockcharts.com
