A trend is an important concept in day trading. It is the ultimate goal of any trader to identify a trade early and then ride it to the very end.
If you wonder why the answer is simple: identifying a trend as soon as it forms and riding it to its peak is the best way to maximize your profits.
But the direction is not the only important thing. Knowing the strength of the trend is also crucial-though often underestimated-aspect for traders.
In this article, we will identify some of the top strategies to identify the direction and strength of a trend.
Phases that assets go through
For starters, financial assets go through a number of phases in the market. There are times when assets move in a definite direction following a trend, while other times they float within a certain range.
Then there are times when volatility is high, with a lot of uncertainty, while other times the asset movements are minimal.
Trending
First, a trade can go through a trend. In technical terms, an uptrend forms when the asset is forming a combination of higher highs and higher lows. A downtrend forms when there is a lower low and a higher low.
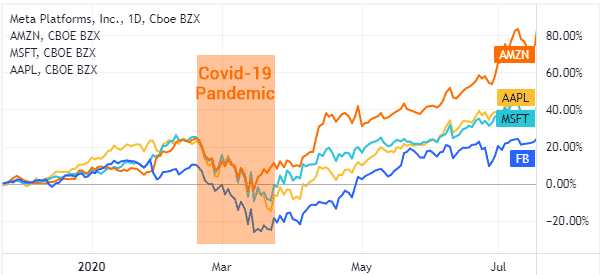
A good example of a trending market is what happened in the stock market during the Covid pandemic.
Ranging
An asset can also be in a ranging market. This is where it moves sideways and remains in a tight range for some time. In most cases, this ranging market happens when there is an indecision in the market or when participants are waiting for important news or data.
A ranging market is relatively difficult to trade since the asset does not make strong moves.
Volatility
Finally, an asset can experience a period of volatility. This happens when the price is neither range-bound or experiencing a strong upward or downward trend.
An example of a volatile market is when a stock rises by 5% on Monday, falls by 4% on Tuesday and soars by 7% on the following day.
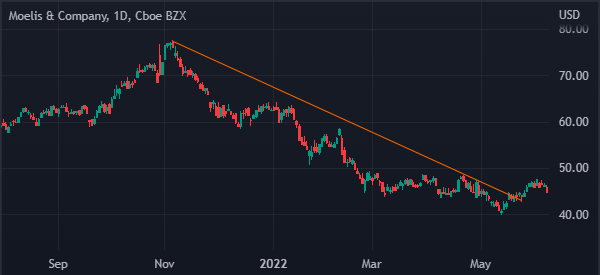
The chart shows Moelis share price in a downward trend.
How to spot a trend
A common question among new traders is on how to spot a trend in the market. Let us look at some of the best strategies to identify a trend.
Multi-timeframe analysis
One of the best approaches to identify a trend is known as a multi-time frame analysis. It is a simple term that refers to a situation where you look at a chart in different timeframes.
The idea is based on the fact that an asset can be in an uptrend in a daily chart and then move in a sharp downtrend in a one-minute chart.
Related » How Many Timeframes Should You Use?
Therefore, it is highly recommended that you conduct a good multi-timeframe analysis to identify a trend and its strength. For example, an asset is said to be in a strong uptrend when it is moving upwards in key timeframes.
52-week high and 52-week lows
Another approach of identifying trending assets is to use the 52-week high and 52-week low tool. This is a screener that looks at all stocks and identifies those that are reaching their 52-week highs and 52-week low.
Ideally, in some cases, a stock that moves to a 52-week high is seen to be in an upward trend and vice versa. But, as you will find out, a stock can hit a 52-week high and be in a volatile environment.
Technical indicators
You can also identify a trending asset by looking at some trend indicators. Examples of top trending indicators are moving averages, Bollinger Bands, and the Average Directional Index.
The latter is a popular indicator that measures the strength of a trend. When it moves above 25, it is a sign that the trend is strong.
Moving average is another popular indicator to identify the strength of a trend. For example, if a stock is trading at $100 and the 25-day moving average is at $60, it is a sign that the uptrend is relatively strong.
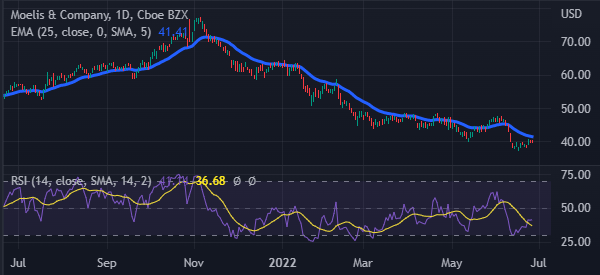
Oscillators are also useful in trend trading. For example, oscillators like the Relative Strength Index (RSI) and the Stochastic Oscillator are useful since they identify when a stock is overbought or oversold.
The chart below shows that the stock is moving to the oversold level. It is also below the 25-day moving average.
Best strategies to trade trends
So, the most important question now is on how to trade trends. There are several approaches to do this. Let’s dive deeper on some of these strategies.
Trend following
The first approach of trading trends is known as trend following. It is a strategy that lets you identify an existing trend and then follow it until the end.
One way of using this trend-following strategy is to use moving averages. The idea is to add a moving average and then holding the trade as long as it is above the MA.
A good example of this is shown in the chart below. As you can see, Exxon Mobil has been in a strong bullish trend. Along the way, it remained above the 50-day moving average.
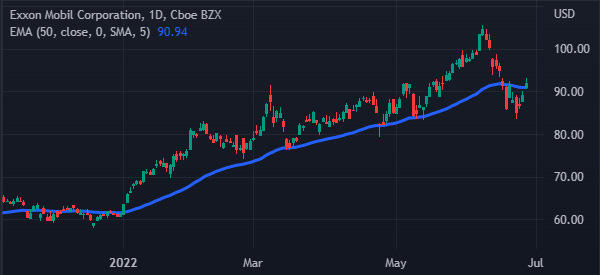
In trend-following, you should hold the trade as long as it is above this average and exit it when it moves below.
Related » How to Identify the End of a Trend?
Buying the dip
Another approach of trend trading is known as buying the dip. This is a strategy where you focus on buying a trending asset when it makes a pullback.
It is a strategy that works well during a trending period. However, it can also be a risky strategy when there is a trend reversal.
Trend reversal
Another way to trade trends is to focus on when reversals happen. This is a situation where you use several approaches to identify when a new trend has emerged.
There are several strategies to use. For example, you can use patterns like head and shoulders, rising and falling wedges, and double-top.
Trend continuation
In addition to this, you can use price action to trade trends. This is a process where you use chart patterns like ascending and descending triangle and cup and handle to determine whether to buy or sell an asset.
Summary
In this article, we have looked at what trends are and identified some popular strategies to use when trading the strategy. In summary, you will be more successful if you are able to identify a trend early and know when to exit when a reversal is happening.
External useful resources
- The Right Side of The Market – Trading Strategy Guides
