Overbought and oversold levels are periods when a stock, currency pair, or commodity reaches extreme levels. These levels are important because they often give signs on when to exit a trade or double-down on the situation.
In this article, we will look at what these two levels are, how to identify them, and some of the best ways to trade them.
What is an overbought level?
An overbought level in the financial market can be viewed as the technical version of being overvalued. An overvalued financial asset is one whose real value is not in line with its intrinsic value.
For example, if a company making $20 million per year has a market capitalization of more than $5 billion, it can be said to be overvalued.
An overbought level in stocks refers to a period when an asset’s price has been bought so much. It is often meant to signal that the asset will start to decline as the existing buyers start to liquidate their positions.
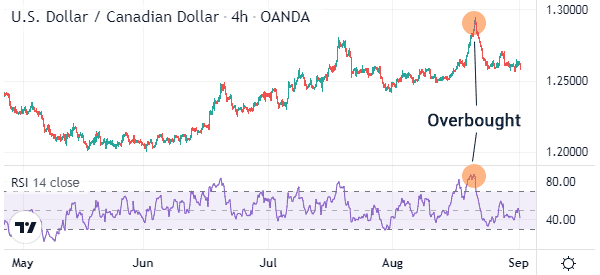
An overbought level can emerge immediately when a financial asset’s price has a parabolic move. At other times, the level can emerge gradually. You could see a good example of an overbought level in the chart below.
What is an oversold level?
An oversold level is the exact opposite of being overbought. It refers to a situation where the price drops too much such that close watchers start thinking that it has been oversold. In fundamental analysis, such a situation is known as being undervalued.
An oversold period can happen immediately after a financial asset makes a parabolic dip. Such dips happen after a major economic data, earnings, or news event. Similarly, an undervalued situation can happen in a long period of time.
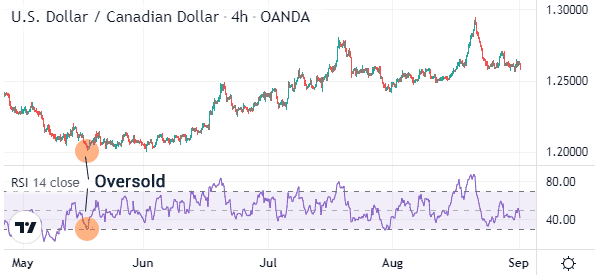
The chart below shows a financial asset whose price is at an oversold level.
How to spot oversold and overbought levels
The easiest way of spotting overbought and oversold levels is to look at them visually. At times, you can look at a chart and see that its price has risen to overbought or dropped to oversold levels.
The other way is to use technical indicators, popularly known as oscillators. Fortunately, there are many such indicators, most of which we have covered before. Some of the most popular indicators that show overbought and oversold levels are:
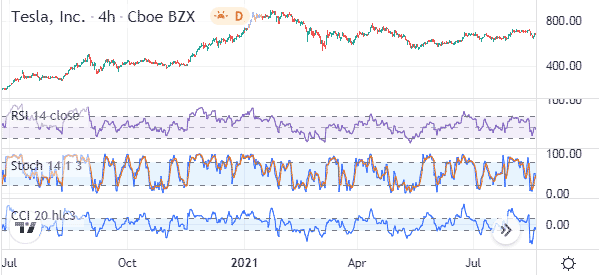
- Relative Strength Index (RSI) – This is the most popular indicator that is used to identify overbought and oversold levels. The indicators measures the rate of change of asset prices. The price is said to be overbought when it rises above 70 and oversold when it drops below 30.
- Stochastic oscillator – This is a technical indicator that weighs the current price of an asset as a percentage of the recent range. An asset’s price is said to be overbought when it rises to above 80 and oversold when it drops below 20.
- Commodities Channel Index (CCI) – This is an oscillator that was initially aimed for commodity traders. The indicator measures the current price level relative to its average price. The price is said to be overbought when it crosses the upper band and oversold when it crosses the lower side.
The chart below shows Tesla share prices with the RSI, Stochastic, and the Commodity Channel Index (CCI).
Other technical indicators (a bit less effective)
The other popular indicators used to identify overbought and oversold levels in the financial market are:
- MACD – The moving average convergence and divergence is an indicator that has two lines. It is developed by just turning moving averages into an oscillator. An overbought level emerges when the two lines rise sharply and vice versa.
- Money Flow Index (MFI) – The MFI is an indicator that incorporates volume into the Relative Strength Index (RSI). As such, its interpretation is similar to that of the RSI.
To identify these levels You can also use Chaikin Oscillator, DeMarker, Relative Vigor Index (RVI), and the Force Index.
How to trade overbought and oversold levels
A common challenge among many traders is how to use these levels when they identify them. Besides, identifying overbought and oversold levels is not a difficult thing.
Indeed, a common mistake that has cost many traders a lot of money is to sell an asset just because a key indicator has moved to the overbought level. Similarly, many traders buy an asset or exit the trade when the indicator moves to the oversold level.
In most cases, this is wrong since the price tends to continue with the original trend even when it reaches those extreme levels.
The same concept applies in fundamental analysis, where stocks tend to rise after getting substantially overvalued. Indeed, historically, overvalued stocks tend to underperform their undervalued peers.
Identify the causes of the price
Therefore, trading overbought and oversold levels require doing more work. First, you need to identify why an asset’s price has reached such a level.
In most cases, the reasons are related to news and economic data like employment and interest rate decision. Therefore, if the weight of the data is strong, the price could keep rising.
Technical indicators
Second, you need to use some technical indicators. The ones we presented above are an excellent selection from which to start developing your strategy. We prefer combining oscillators like the Relative Strength Index with trend indicators like moving averages and Bollinger Bands.
Other trading concepts
Finally, you should use more concepts of trading like harmonic patterns and Elliot wave patterns to determine whether the price will keep rising. Also, you should add more tools like the Fibonacci retracement.
In other words, you should not use overbought and oversold concepts singularly.
Final thoughts
Overbought and oversold levels are essential in the financial market. In this article, we have looked at how they work, how to identify them, and some of the most important concepts of trading them.
External Useful Resources
- Detecting Statistical Overbought & Oversold Levels on Technical Indicators. – Geekculture on Medium
