The options market provides useful information to traders because it shows how large investors and people with inside information are positioning their positions.
Indeed, the options information has been used to create several trading tools like the fear and greed index and the CBOE volatility index (VIX).
In this report, we will look at the imbalance locator, which is an important tool that we provide in our PPR08 trading software.
What is the imbalance locator?
Ideally, the market is usually a battle or tug of war between buyers and sellers. Whenever buyers win, the price tends to go up. Similarly, when the sellers win, the price tends to decline. Therefore, the imbalance indicator is a tool that provides more information about the market when it opens and when it closes.
The open and close are usually among the most important periods in the options market. The imbalance tracker, therefore, helps traders have a feeling about stocks before and during the trading day.
» Related: Trading the close
This data is provided to brokers by the respective exchanges. Therefore, you should confirm whether the brokerage provides this tool.
What is an order imbalance?
An order imbalance is a situation in the financial market when there is a mismatch in the volume of buyers and sellers of a particular stock or any other asset.
As a result, the executing team, which is known as market maker often finds it difficult to execute the order. For example, the volume of sell orders may be significantly higher than buyers.
In some cases, exchanges may suspend the stock that is having such an imbalance. A good example of this is when Russia invaded Ukraine and western countries announced major sanctions. As a result, many Russian stocks declined sharply, leading to a major imbalance. In other words, they became uninvestable, pushing exchanges to suspend them.
Common causes of order imbalances are weak earnings, a major corporate scandal, a strong investigation, and geopolitical issues.
When do these imbalances occur?
As mentioned above, there are several causes of order imbalances in the market. Some of the most common times when these imbalances occur are:
- Weak earnings – At times, a company can publish weak earnings and guidance, pushing the stock sharply lower.
- Geopolitics – in other times, geopolitical factors could lead to these order imbalances such as when there is a trade war or a major issue.
- Natural – At times, natural disasters could lead to imbalances. For example, when there is a major natural disaster, insurance companies could sell-off.
- Technical hitch
How an imbalance tracker is structured
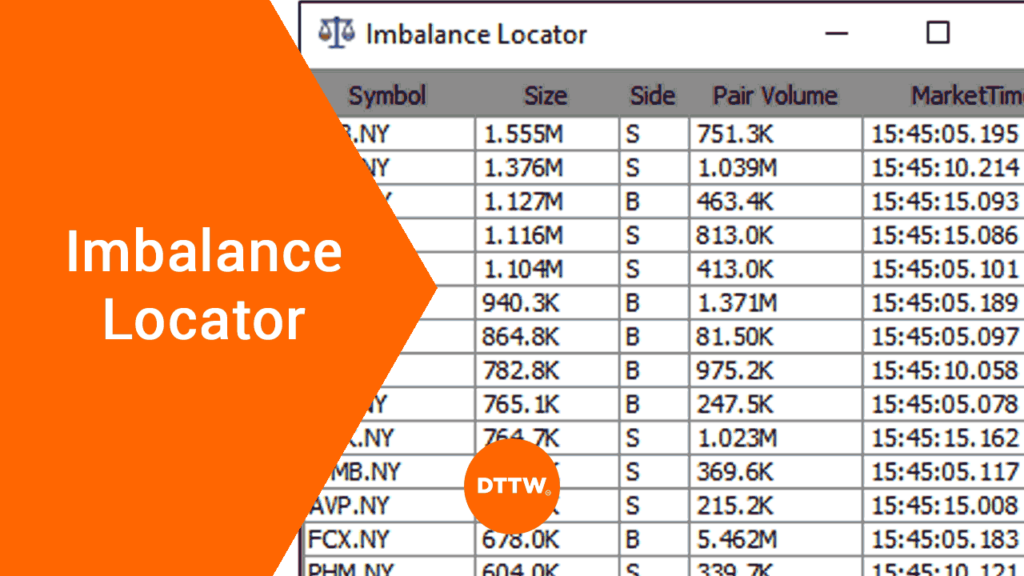
The screenshot below shows how the imbalance tracker in the PPro8 looks like.
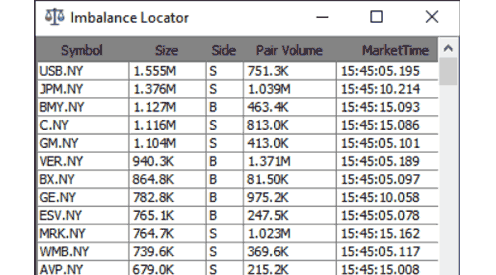
As you can see, the imbalance is made up of several columns. On the left side is the symbol, which is simply the ticker name of the stock. For example, JPM is the ticker symbol for JP Morgan while GE is the ticker for General Electric.
After the symbol is the size, which measures the size of the imbalance shares. Ideally, a higher volume that is above the average is usually a sign of confidence by the market participants. Next is the side, which can either be S, B, or N. S stands for sell, B for buy, and N for neutral.
The next column is the pair volume. This column shows the number of shares that have already been executed during the auction process. Finally, the market time is the exact time at the market.
Other customizations
Still, there are more options that you can get by right-clicking on the asset. These are the auction price, continuous price and size, and the type. The type can be market open, halted, or market close.
Most importantly, you can customize the imbalance locator to show companies in the exchange that you want to trade.
How to use it: imbalance locator trading strategies
The process of using the imbalance locator is relatively simple. However, it can be relatively difficult for new traders. Also, you should not use it in a vacuum. Instead, you should use it as complementary tool to help you in the overall analysis.
Check the news
A good way to start is to check out the overall news in the market. For example, if you are using information in the premarket, you need to check out the stocks that are moving and then you check out the catalysts behind the moves.
For example, if you see Twitter stock rising or falling, ensure that you know why this is happening. A good way of doing this is by subscribing to our free daily watchlist that will give you this information.
› Why you need to use (or built) a watchlist
Stock, volume and pared volume
Next, you need to look at the stock, volume, and the pared volume. For example, in the chart above, we see that GM has a volume of 1.10 million and a pared value of 413k. This means that there is about 1.5 million volume of imbalance.
» Related: Understand Stock Volume
With this being a sell order, it means that there was more demand for sell orders on the company. However, you should always look at the pared volume to see whether the demand for the shares is being matched.
Final thoughts
The imbalance indicator is an important tool that can help you see the action in the market. It can help you find important information about shares that are seeing significant moves. However, as mentioned above, you should use it in addition to other tools like technical indicators and volumes.
External Useful Resources
- Imbalance Locator Tool on PPro8 – PPro8wiki
