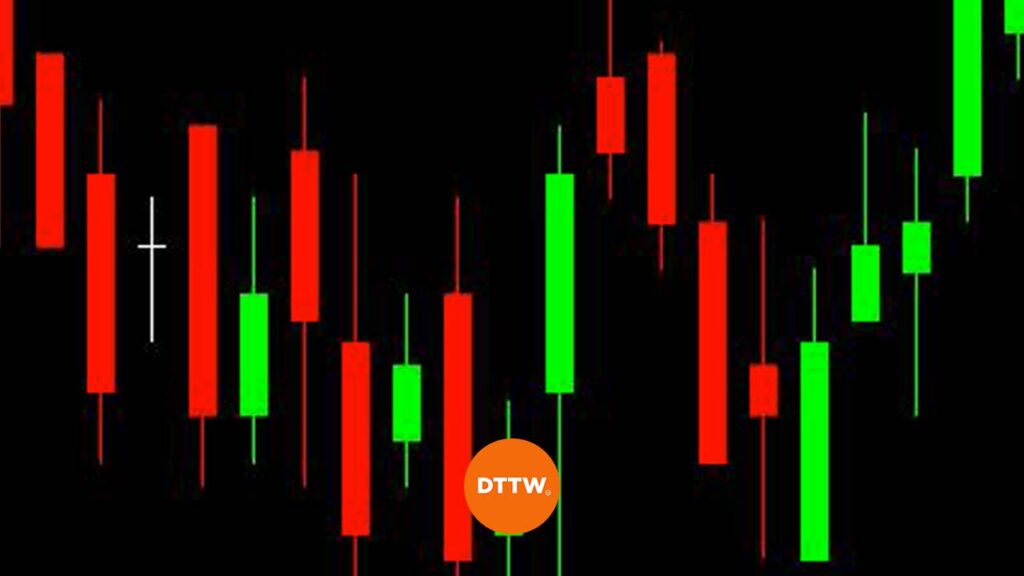
There are several types of charts that you can use in the financial market. What is not known well by new traders is on the importance of these charts.
You can have a good example of this in the chart below.
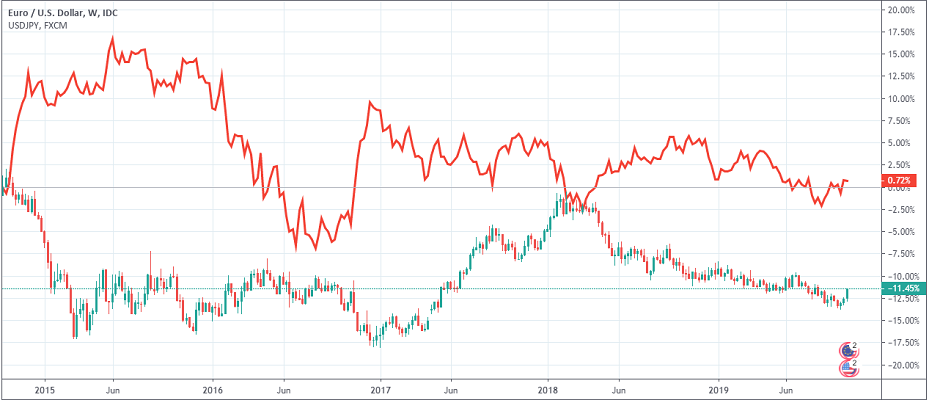
The chart shows a line graph of the USD/JPY pair and a candlestick chart of the EUR/USD pair. These two charts are necessary!
The line chart is a good one to show the trend of the pair. However, it does not tell traders what to do. As such, it is not a useful chart to use when trading.
This is unlike candlesticks, which are the most popular charts. Other types of charts you will encounter in the market are bar charts, step lines, histograms, circles, renko, and columns among others.
In this article, we will highlight some of the best candlestick patterns and how to use them in the market.
What is a Candlestick Chart?
Japanese candlestick patterns are some of the oldest types of charts. These charts were discovered hundreds of years ago in Japan, where they were used in the rice market. Today, these charts are the default when you open most trading software (Ppro8 too!).
Candlesticks are important charts used by financial traders and investors. They are the most preferred charts in the market since, unlike line and bar charts, candlesticks provide more details about an asset price.
Brief History of candlesticks
Candlesticks have been used for a longer period than you think. They were initially used in Japan by rice traders in the 1600s. At the time, these merchants and traders relied on these charts to understand the overall trend and then predict the future prices.
Today, candlesticks are used widely in the financial markets by both short-term traders and investors. They are usually ideal because they provide more details. For example, a line chart shows either the closing or opening prices while renko ignores the important time factor of an asset.
Parts of a Candlestick
In the first chart above, you can see that a line chart is pretty basic. It is just a line. Unlike a line chart, a candlestick has more parts that help traders know when to buy and when to sell.
This is shown in the image below.
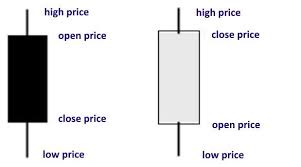
The two images shows a bullish and a bearish candlestick. The black one is bearish candle while the one on the right is the bullish candle. The black and white parts of the candles are known as the body while the two lines are known as shadows.
The shadow and body of a candlestick chart is so important. For example, in a hammer candlestick, a long shadow means that the reversal is more convincing. At times, you will identify a candlestick with just a body and without shadows. This is known as marubozu.
Therefore, in a daily chart, a single candle usually represents a day. In a hourly chart, a single chart usually represents a hour. Candlestick patterns in day trading usually work with minute chart.
Benefits of using Candlestick Charts
There are many benefits of using candlesticks patterns when trading. Some of these benefits:
- They tell us more – Unlike other types of charts, candlesticks tell us more about the financial asset. For example, they tell us when it opened and when it closed.
- More accuracy – Candlestick patterns are usually relatively accurate in predicting the future price of an asset.
- Used by most traders – These charts are used by most traders in the market. This means you are in good company.
- Reversals and extensions – Candlesticks are excellent in helping you identify reversals and extensions.
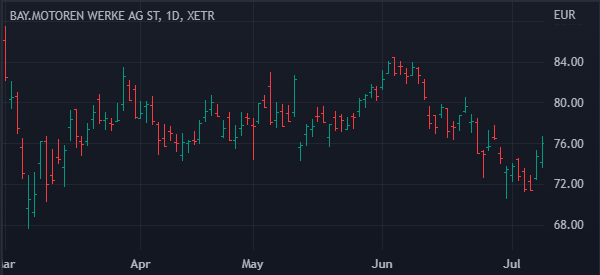
Candlesticks vs bar charts
A common question is on the difference between candlesticks and bar charts. The two charts have a close resemblance but they have a major difference.
Bar chart does not have a body as you can see below. As such, it is relatively difficult to trade using a bar chart. The chart below shows how a bar chart looks like.
How to read the candlestick in day trading
As we saw above, a candlestick is made up of two important parts. First, there is the upper and lower wick or shadow.
The upper part of the wick shows the highest point in a session while the lower side shows the lowest point.
Second, there is the body, which shows the price between the open and close. In some cases, there are candlesticks that don’t have the upper and lower wicks.
Candlesticks, on the other hand, have four important parts: Open, High, Low, and Close. Let us look at this in the chart below.
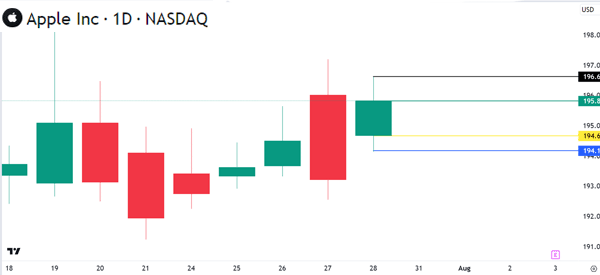
In it, the open price was $194.67 while the closing price was $195.82. The highest point was $196.62 while the lowest level of the session is $194.17.
The first thing you need to look at when analyzing candlesticks is the period. If the chart is a daily one, it means that each candlestick represents a day. Similarly, if the chart is a five-minute one, each bar represents five minutes.
The next thing to look at is the color.
In the example above, we see that there are red and green candles. In this case, a green candle means that an asset’s price rose during that period while a red one means that it dropped. Most charting platforms have tools to let you change the default colors.
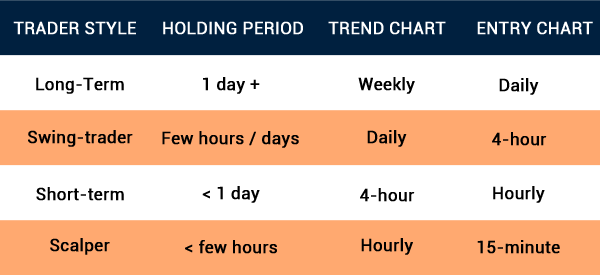
Candlestick chart timeframes
As mentioned, a chart timeframe is an important part in the market since different traders and investors have their own strategies. In most periods, an investor who focuses on buying and holding assets for a long time uses longer charts like daily and weekly. Such people don’t use extremely short-term charts at all.
On the other hand, scalpers, who open tens of trades per day, use extremely short-term charts. In most periods, these traders use charts that are less than 5 minutes. Further, swing traders use charts that are hourly or less.
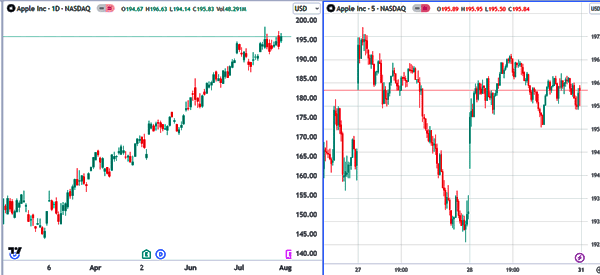
For example, on the left side, we have a daily chart showing that the Apple shares are in a bullish trend. And on the right side, the five-minute chart shows that the stock is moving sideways.
Some traders look for confirmation of a reversal or a continuation in longer timeframes. For example, the evening star pattern is invalidated if the price ends the day above the upper part of the pattern.
How to identify candlestick patterns
Below, We will explain some of the most popular candlestick patterns. Before that, it is important for you to know how to identify candlestick patterns.
First, always start your analysis by doing a multi-timeframe study. This is where you look at three timeframes and learn about each of them individually.
The benefit of doing a multi-timeframe analysis is that you will find patterns across all charts. For example, you can find a hammer pattern in a daily chart and a bullish engulfing in the hourly chart.
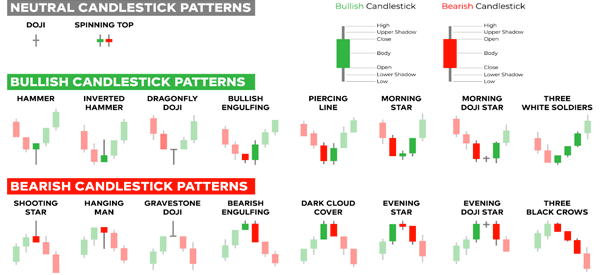
Second, if you are new to these candlestick patterns, a simple way is to use a candlestick cheat sheet that lists all of them. A good example of such a cheat sheet is shown below.
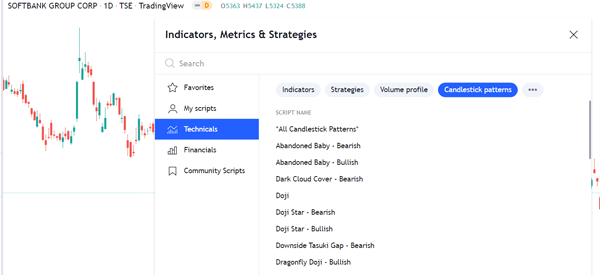
Finally, you can use an automated method to find candlestick patterns.
TradingView has an excellent tool that does that. Just open your chart, go to technicals, and then candlestick patterns as shown below. You can then select all candlestick patterns and the tool will overlay them on the chart.
What do candlestick patterns tell you?
Candlestick patterns can tell you a lot of information. The most basic ones are reversals and continuations. Some candlestick patterns like hammer and doji tells you that the existing trend is ending and a new one is about to form.
Second, the size of a candlestick can tell you the strength of the signal. For example, a hammer with a long lower shadow means that the reversal will be much strong.
Third, the pattern can tell you where to place your pending orders. For example, with a bullish engulfing, it makes sense to set a buy-stop above the upper shadow and a sell-stop at the lower shadow.
Fourth, it can tell you the support and resistance lines. These are important lines that you always need to know when opening and closing
Use candlestick patterns to find support and resistance
A very good strategy for using candlestick patterns is to find support and resistance levels. A support is a floor where an asset fails to move below while a resistance is a ceiling where it struggles to move above.
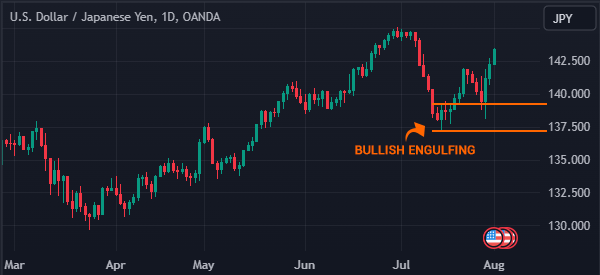
Most candlestick patterns have these support and resistance levels. For example, the chart below shows a bullish engulfing pattern, which is usually a positive sign. In this case, the upper and lower swings are resistance and support levels.
As such, you can place a stop-loss of a bullish trade at the lower side of the engulfing pattern. Also, you can place a buy-stop trade above the bullish engulfing candle.
Candlestick patterns and market sentiment
Candlestick patterns are unique formations that happen in either a single candle or a number of them. Examples of the most popular candlestick patterns in the market are shown below, and each of these has its own uniqueness.
These patterns can give you more information about market sentiment. The most popular sentiments are known as reversal and continuation.
For example, when reversal chart patterns like shooting star, morning star, and hammer form, it is usually a sign that the mood in the market is about to reverse.
On the other hand, when some patterns like the three black crows and three white soldiers form, it is a sign that the trend will continue. Therefore, these candlestick patterns, when they are supported by volume, can tell you what to expect in the market.
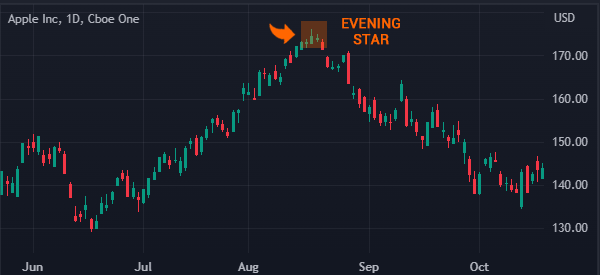
A good example of this is shown in the chart below. In it, we see that the Apple chart formed an evening star pattern, leading to a reversal.
The psychology behind candlestick patterns
Experts believe that there is usually a psychology behind most candlestick patterns like hammer, doji, and engulfing.
A good example of this is the hammer pattern, which is characterized by a small body and a long lower shadow. When it happens, a bullish reversal is confirmed when the price moves above the asset’s body.
There are other psychological parts of candlestick patterns. For example, there are psychological events like the fear and greed index and the market sentiment. Fear and greed are the most popular psychological factors in the market since greed pushes prices higher and vice versa.
Therefore, candlestick patterns like hammer and bullish engulfing can trigger greed in the market while shooting stars can trigger fear.
Candlestick patterns in different market conditions
There are three main types of market conditions that you will experience. First, there is a market condition known as trending, which happens when an asset is rising or falling.
It is characterized by a series of higher highs and higher lows and lower lows and lower highs. These are the best market conditions since you can buy low and sell high.
Second, there are volatile markets, which happens when assets are moving in wider ranges. For example, a stock can open at $10, rise to $14, and then end the day at $9.
Finally, there are periods when an asset is usually in a tight range. The chart below shows when a forex pair is trending and in a tight range.
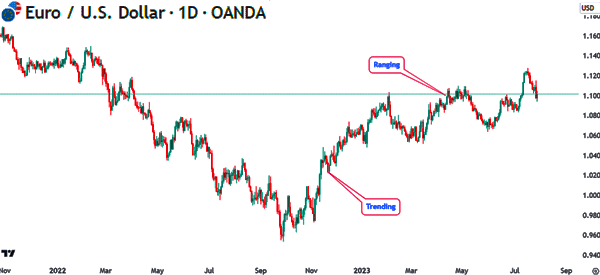
Candlestick patterns are not usually applicable in range-bound markets. The best time to use them is when an asset is trending upwards or downwards. When it is falling, candlestick patterns like doji and hammer are signs that a reversal is about to happen.
Combining candlesticks with technical indicators
Day traders use candlesticks in a number of ways. First, they focus on candlestick and chart patterns to predict the next movements. The other way is to use technical indicators. An indicator is derived using mathematical calculations.
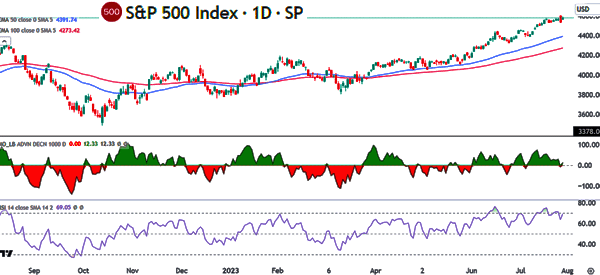
There are hundreds of technical indicators in the market. These indicators are divided into several categories like trend, oscillators, volume, and breadth among others. The best trend indicators are moving averages and Bollinger Bands.
Oscillators include the Relative Strength Index (RSI) and the Stochastic Oscillator. Volume indicators include the accumulation/distribution (A/D), Volume Weighted Average Price (VWMA), and Money Flow Index (MFI).
Breadth indicators include McClellan Summation Index (MSI), McClellan Oscillator, and Net New High and Net New Lows among others.
Traders use candlesticks with technical indicators differently. Some traders rely on one indicator while others add several indicators in a chart.
One of the best options, as shown below, is to use trend, volume, and oscillators. This chart has moving averages, McClellan Oscillator, and the RSI.
Best Candlestick Patterns for day trading
A good way to use candlesticks is to use the popular patterns. There are many patterns that have been identified that help to show reversals and new patterns.
Some of the common types of reversal candlestick patterns are:
- Hammer and inverted hammer
- Hanging man
- Shooting Star
- Evening and Morning Star
- Bullish and bearish engulfing patterns
- Dark cloud cover
- Piercing patterns
- Pin bar
among others. Other patterns are morning and evening star, shooting star, and Dojis.
Backtesting candlestick patterns
Backtesting is an important part when building a trading strategy. It is the process where you use historical data to assess the effectiveness of a chart pattern.
One of the most effective approaches to backtesting an asset is to use a strategy tester, which is provided by most platforms.
However, for candlestick patterns, you can only use the manual approach to backtesting. The manual process is where you dedicate some time to assess the performance of candlestick patterns across various timeframes.
For example, you can take a candlestick pattern like the hammer and then see how it trades in various assets. In most cases, the hammer is followed by a bullish reversal. Therefore, taking time to assess how these patterns work over time will help you in your day trading.
You should then use the backtesting data to do forward-testing, where you use a demo account to experiment these patterns.
Back and forward testing will help you know how to use these candlestick patterns. It will also help you avoid some of the most common challenges involved in the market.
Example of Candlestick Pattern at work
As you see, there are so many candlestick patterns that you can use in the market. In this article, we will look at just one and see how to use it when doing analysis.
When you look at the EUR/JPY pair shown below, there are several candlestick patterns that you can see.
A good one is the one we have labelled a bullish engulfing.
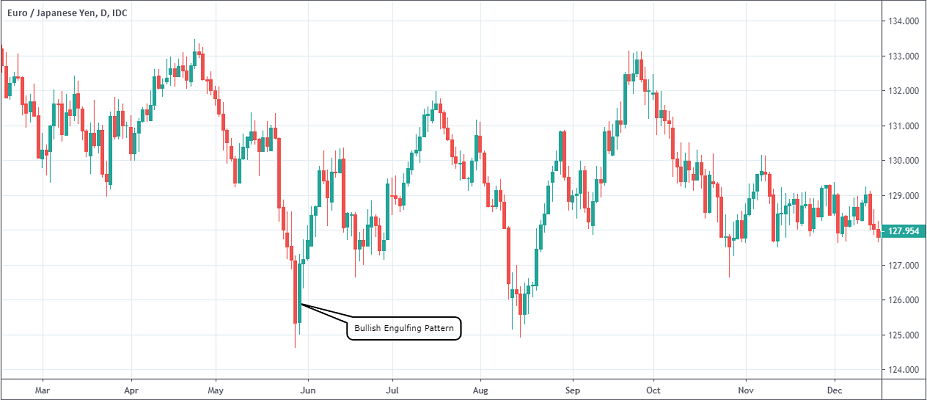
To spot a bullish engulfing pattern, you need to first identify when a chart is moving downward trend.
In this, you need to spot a chart with several consecutive bearish bars (in this case, we identified a chart with several red bars). The candlestick pattern is established when a long bearish candle is followed and a smaller bullish candle.
This candle must be completely engulfed by the bearish candle. When this happens, it is usually an indication that a new upward trend is starting.
Common mistakes when using candlestick patterns
There are several mistakes that people make when using candlestick patterns. First, there is the mistake of not incorporating volume in the market.
You should remedy this by basing all your decisions on the volume. If a pattern forms in a period without volume, it could be a sign that the thesis will not stick.
Second, there is the mistake of rushing to open a trade when a pattern forms. In this case, a trader will open a bullish trade when the hammer or doji pattern forms. This is wrong. Instead, you should wait to confirm the trend.
Third, not having a stop-loss and a take-profit. These tools are important for risk management in the market. All your trades should always be protected. Finally, you should avoid the mistake of not doing a multi-timeframe analysis.
Summary
We think this is pretty clear: anyone who wants to day trade needs to know and master candlestick charts.
You cannot profitably trade with candlestick-based patterns and indicators without knowing first what a longer shadow or smaller body means.
Nor is it necessary to master all the candlestick patterns (there are about 50 different ones); if you know how to use the ones we have listed, you will have all the tools you need to become an excellent trader.
External useful resources
- Definition and simple Candlestick pattern – Wikipedia
- Pattern Dictionary – StockCharts School
