As we have mentioned before, there are many technical indicators you can use in the market. These indicators are available in all trading platforms like MT4, TradingView, and PPro8.
You don’t need to know how to use all these indicators. In fact, the best traders are those who take time to master less than five indicators!
In the past few weeks, we have covered a number of indicators like the RSI and the average directional index. Here, we will look at the Keltner channel.
This is not a very popular indicator and you won’t find it built-in the MT4 (but we provide in our Trading Platform).
What are Keltner Channels?
Keltner Channels are envelopes that have a close resemblance to the Bollinger Bands, as shown below. They are volatility envelopes that surround an exponential moving average.
Further, instead of using the standard deviation as the Bollinger Bands do, the Keltner Channels use the Average True Range (ATR), which is one of the most popular indicators used to measure volatility.
The formula to calculate it
As we have written before, knowing how an indicator is calculated is not mandatory. Not many people in Wall Street can tell you how most of these indicators are calculated.
In any case, the Keltner channel is calculated in three steps.
- First, you calculate the 20-day moving average.
- Second, you calculate the upper channel line. This is calculated using the following formula: 20-day EMA + (2 x ATR(10)).
- Third, the lower channel line is calculated using this formula: 20-day EMA – (2 x ATR(10)).
As always, you can change these values depending on your trading strategy.
Keltner Channel vs Bollinger Bands
The Keltner Channel is a technical indicator that is very similar to Bollinger Bands. Bollinger bands are volatility or trend indicators that are formed by a moving average and standard deviations.
The are few differences between the Bollinger Bands and the Keltner channel indicator. For first, the latter uses the average true range instead of the standard deviation (so Keltner are usually smoother).
The average true range indicator is an oscillator that traders use to see whether there is volatility in the market.
Another difference is that while Bollinger Bands use the simple moving averages (SMA), the Keltner channel uses the exponential moving average (which is more sensitive).
The EMA is used to dictate the direction while the ATR is used to set the width.
Therefore, the channel is used to identify reversals with channel breakouts and channel direction. The original period of the Keltner channel was 10-days. This was changed to 20 by Linda Bradford.
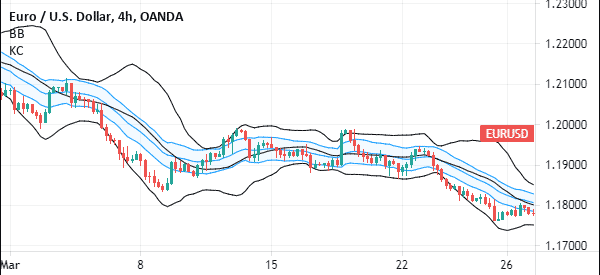
The chart below shows the EUR/USD pair with the Bollinger Band and Keltner Channels. The Bollinger Bands are shown in black while the Keltner Channels are show in blue.
How to set the Keltner Channels
To use most indicators, it is always important to check out the inputs. When using Keltner Channels, the default setting is usually 20 and a multiplier of 1. Also, you can change the bands style by selecting whether you want the average true range (ATR), true range (TR), or the range.
You can also select whether you will apply this action on the opening or closing price. While we recommend using the default settings, you can tweak these figures to meet your preferred criteria.
Keltner Channel Strategy
A general rule about all channel-related indicators is that they are designed to encompass the price action. Therefore, any move that happens outside the channel needs to be looked at carefully because they are so rare.
In this case, when the price moves above the upper line shows significant strength on the upward trend. A break below the lower channel shows that the bears are becoming more successful.
A good example of the Channel action in action is shown on the ETH/USD pair below.
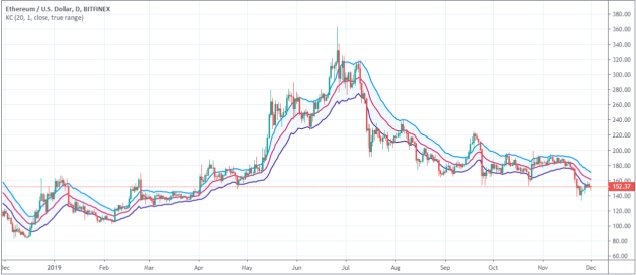
As you can see above, the price of the pair was above the upper line of Keltner channel when the price was moving upwards. The opposite happened when the price was falling. The price was below the lower line of the Keltner channel.
Keltner Channels in Trend Following
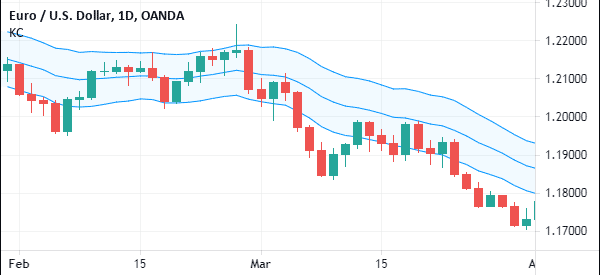
The Keltner Channels are used widely in trend following. This is a strategy where you buy into an existing trend. Therefore, if the price of an asset is falling, it will remain in a downtrend so long as the price is below the three lines of the Keltner Channel.
This trend will be invalidated if the price manages to move above the lower line of the channel, as shown below. You can use the same strategy during a downtrend.
Final thoughts
Keltner Channels are not very popular in the market. Indeed, you will not find them installed in MT4 and MT5. You have to install them manually. Yet, when used well, they can be ideal for any day trader who wants to find buying or selling opportunities.
External Useful Resources
- Simple Trading Strategies Explained – Forex Training Group
- Keltner Tutorial and Examples – Stock Charts
