Know Sure Thing is an indicator that has a close resemblance to the MACD. It was first proposed in 1992 in the Stocks and Commodities magazine, which was a relatively popular publication then.
In this article, we will look at what it is and how you can use it in day trading.
What is the Know Sure Thing indicator?
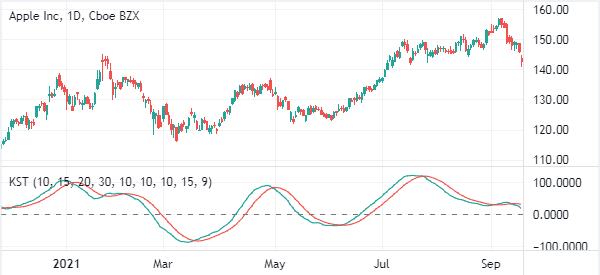
The Know Sure Thing (KST) is an oscillator that measures the price momentum of four different cycles of an asset and then translates this into one indicator. It resembles a MACD in that it has two lines of different colors that move up and down. It also has a centerline that is closely watched by traders.
Therefore, while the two are different, the KST indicator is mostly used in a similar way as the MACD. This means that you can use it to find divergences and even in trend following. The chart below shows the KST applied in an Apple daily chart.
How KST is calculated
The general thesis of the KST indicator is relatively simple. It simply looks at the weighted average of four rate-of-change values that have been smoothed. For example, you could calculate a 20-day rate of change of an asset and then smooth it with a 20-day moving average. By smoothing it, you remove the noise.
» Related: What is Rate of Change
So, here is the formula of the KST indicator.
- Rate of Change 1 = 20-period SMA of 10-period ROC
- Rate of Change 2 = 20-period SMA of 15-period ROC
- Rate of Change 3 = 20-period SMA of 20-period ROC
- Rate of Change 4 = 25-period SMA of 30-period ROC
After doing this, you calculate the KST by using the following formula:
| Know Sure Thing = (RCMA1 X1) (RCMA2 x 2) + (RCMA3 x 3) + (RCMA4 x 4) |
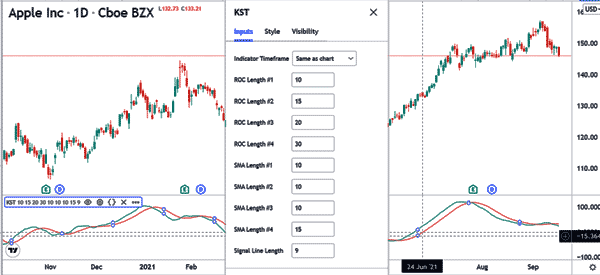
The signal line of this will be the 10-day period of the KST. Still, you can use any figures that meet your criteria. The chart below shows the settings of the KST indicator applied on the daily chart.
How to use the KST indicator
There are several strategies of using the KST indicator. In our experience, most traders use it in trend following, finding reversals, and finding divergences.
Know Sure Thing in trend following
Trend following is a strategy where you buy a financial asset whose price is rising or short one that is already falling. The goal is to move with the flow until it ends. Trend following actually applies Newton’s law of motion that states that an object remains in motion until it finds an equal force in the opposite direction.
The KST is used in trend following in a relatively simple way. First, you need to spot an asset whose price is already rising or falling. Second, you apply the KST indicator. If you are using TradingView, the indicator is already installed by default. For other trading platforms like the MACD, you will need to download and instal it (we don’t have it in our Ppro8).
Finally, look at the overall direction of the Know Sure Thing indicator. Ideally, the asset’s price will maintain its direction as long as the indicator is rising or falling. A selling or exit signal will emerge when the two lines of the indicator make a crossover.
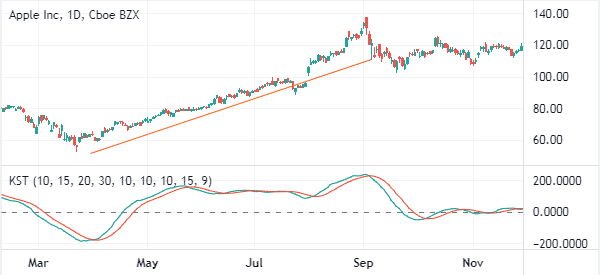
The chart below shows how the KST works in trend following. The asset’s price maintains a bullish trend as long as the indicator is also rising.
Using the KST oscillator to find reversals
A reversal happens when an asset’s price changes direction. In other words, a bearish reversal happens when the asset’s price that is rising changes direction. Similarly, a bullish reversal happens when the asset’s price changes direction and keeps rising.
Therefore, for a reversal to happen, there needs to be a trend in the first place. You can identify reversals using the KST by looking at a situation where the two lines make a crossover. This is shown in the chart below.
Using KST indicator to find divergences
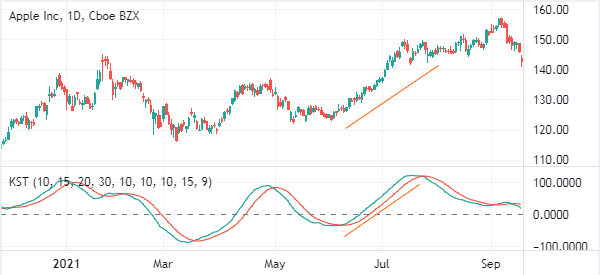
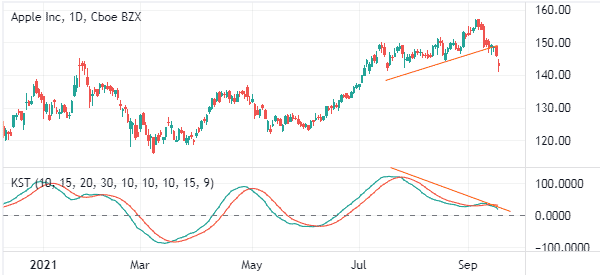
The next approach to use KST is to find divergences. For starters, a divergence happens when an asset’s price moves in one direction while the indicator moves in the other. When it happens, it simply means that the overall bullish or bearish trend is losing its momentum. A good example is shown in the chart below.
Know Sure Thing vs MACD
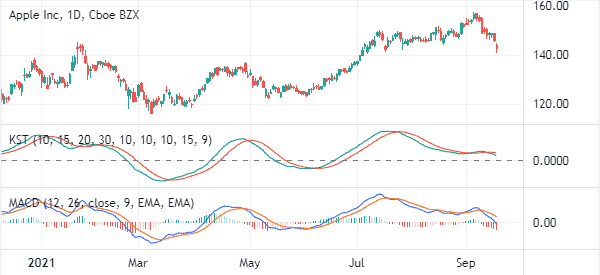
As mentioned, the KST indicator is relatively similar to the MACD. As shown below, the two indicators have a relatively close relationship. Indeed, in most cases, the MACD and KST crossovers happen at the right time.
Still, the two indicators are calculated differently. The MACD is calculated by transforming two moving averages into an oscillator while the KST is calculated by smoothing several rate of change indicators.
The chart below shows the two indicators applied on a chart.
Should you use the KST? Advantages of the KST
In our experience, the KST is a relatively easy-to-use indicator that is also relatively accurate. As shown above, it is easy to use it in trend following, finding divergences, and even in finding reversals.
So, we highly recommend that you use it in combination with other indicators. At the same time, if your platform does not have it, you could substitute it with the MACD since the two work relatively well.
Summary
The Know Sure Thing is a simple-to-use indicator that can be used by all types of traders like scalpers, trend followers, and even algorithmic traders. In this article, we have looked at what it is, how it works, and some of the strategies to use.
External useful Resources
- Algorithmic Trading with the Know Sure Thing indicator in Python – Medium.com
