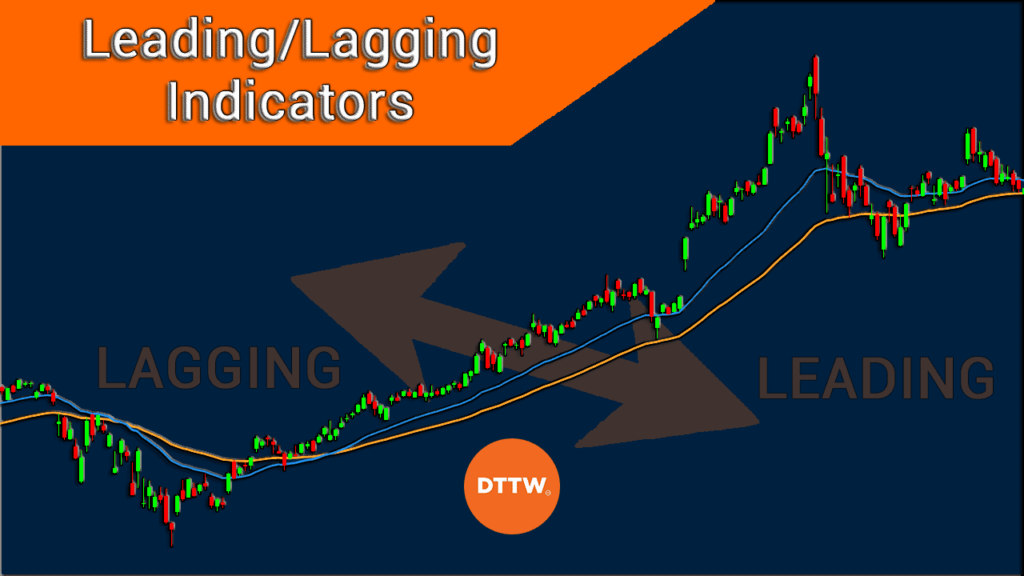
Leading and lagging are the main two types of both technical and fundamental indicators. That’s enough to underscore their importance, right?
In this article, we will look at the meaning of these indicators and how you can use them in day trading.
Leading and lagging indicators in fundamental analysis
Broadly, all economic numbers in the economic calendar are usually divided into two. First, there are leading indicators, which tend to predict the future of performance of the economy. Some of these indicators are often far-seeing while others are relatively nearsighted.
In general, there are ten key leading indicators in fundamental analysis. They include the average weekly hours worked, initial jobless claims, manufacturing and services PMIs, building permits, stock prices, consumer confidence, and interest rate spread between the 10-year Treasury bond and federal funds rate.
In other words, a quick look at leading indicators like initial jobless claims can help you predict the state of the economy. If the economy lost jobs in three straight months, you can easily predict that the economy underperformed in that quarter.
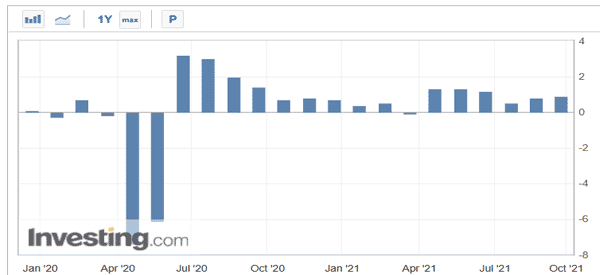
While not closely followed, the leading economic index (LEI) is usually released every month. While it is an important figure, it does not lead to major volatility in the market. The chart below shows the American LEI index.
Lagging indicators, on the other hand, use historical data to predict the performance of an economy. It is made up of the average duration of unemployment, average prime rate, commercial and industrial loans outstanding, and consumer price index data.
In addition to these two, there is another class of fundamental indicators known as the coincident index. These indicators tracks the turning points of business cycles and can serve as a benchmark in assessing the economic statistic to the business cycle.
What are leading indicators in technical analysis?
Meanwhile, indicators in technical analysis are also divided into both leading and lagging indicators. Leading indicators are those that use historic data to predict the future price movement in the market. You can sue these indicators to predict what will happen in the future.
There are many popular types of leading indicators in the financial market. Among the popular types of these indicators are oscillators like the Relative Strength Index (RSI), Stochastic Oscillator, Williams %R, and On-Balance-Volume.
What are lagging indicators?
Lagging indicators, on the other hand, use historical data to provide a delayed feedback about a financial asset. These indicators typically give information that has already passed and are mostly used to confirm a trend. In most cases, these indicators are typically used in trend analysis.
Examples of popular lagging indicators are all types of moving averages (simple, exponential, weighted, and volume-weighted), Ichimoku Cloud, parabolic SAR, and the Average Directional Index (ADX), among others.
How to use leading and lagging indicators
Using the leading and lagging indicators is not a complex thing. In general, you should focus on the two broad types of these indicators.
First, we recommend that you start by using fundamental analysis by looking at the several economic numbers that are released regularly. You should use the economic calendar to see the schedule and the results of these numbers. For starters, the economic calendar contains the schedule of when these numbers are released.
It is also worth noting that some leading data can help you when trading stocks.
For example, new and existing home sales numbers can help you trade homebuilders like Lennar and Toll Brothers. Similarly, retail sales numbers can provide you with more information about retailers like Walmart and Target.
Second, we recommend that you combine the two types of indicators when doing chart analysis. This is where you combine indicators like moving averages and the Relative Strength Index (RSI).
Examples of leading and lagging indicators in trading
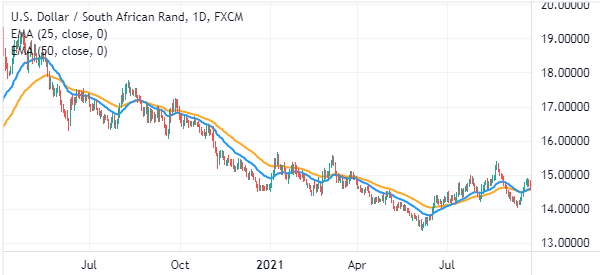
Moving average
Moving averages are lagging indicators that are mostly used in trend following. The indicator uses historical data to predict the direction of an asset.
The simplest way of using moving averages is to buy when an asset’s price is above the moving average. You can also short the asset when the price is below the moving average, as shown in the chart below.
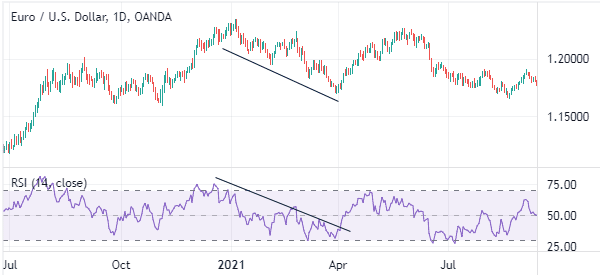
Relative Strength Index (RSI)
The Relative Strength Index is an oscillator that measures the rate of change of a financial asset. It is a leading indicator. The indicator is mostly used to find overbought and oversold levels. You can also use it to find divergences and also in trend following.
In the chart below We show you a good example of this.
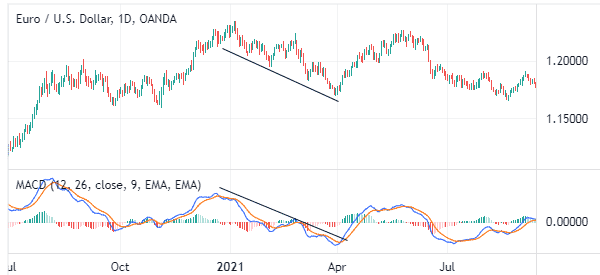
MACD
The MACD is an oscillator created from moving averages. It basically converts the moving averages into oscillators. Like the RSI, the MACD can be used to find divergences, in trend following, and to find overbought and oversold levels.
The chart below shows the MACD used in trend following.
Other leading and lagging indicators that you can use in trading are the Ichimoku cloud, Stochastic Oscillator, and the Relative Volatility Index (RVI).
Summary
Leading and lagging indicators are essential tools in day trading. In fundamental analysis, the two indicators can tell you the state of the economy and what to expect. In technical analysis, the two indicators can help you make better decisions on whether to buy or short an asset.
External Useful Resources
- How to measure the progress of OKRs using Leading and Lagging Indicators – Herbig.co
