Moving averages are the most popular and important technical indicators in the market. They are so important such that they have been used to develop other types of indicators like Bollinger Bands and Envelopes.
In this article, we will focus on the Least Square Moving Average (LSMA) and identify some popular strategies to use.
What are moving averages?
Moving Averages are indicators that seek to identify the mean price of an asset in a certain period of time. For example, if the DocuSign stock is trading at $99 while its 50-day moving average is at $150, it is a sign that the stock is sharply below its average price on that period.
We saw the concept of moving averages being in use multiple times during the Covid-19 pandemic. At the time, if a country reported 1,000 new cases while the 7-day moving average was 500, it was seen as if the situation is getting worse.
There are several types of moving averages in the market. Examples of these averages are exponential moving average (EMA), Hull Moving Average (HMA), smoothed moving average, weighted moving average (WMA), and simple moving average.
What is the Least Square Moving Average?
LSMA, like the other types of moving averages, seeks to remove a lot of noise that exists in the main type of MA. The goal is simple. When calculating the simple moving average, people take every period as being the same.
As a result, this tends to have the challenge of lag because recent data tends to be more useful than those that happened a longer period before.
The least square moving average is more complex than the other types of averages because of how it is calculated. It calculates the least squares regression line for the previous time periods.
As a result, it can be used to predict the next direction of an asset because it determines the line of the be fit. Each point of data in the LSMA usually provides the relationship between a known independent variable and an unknown dependent variable.
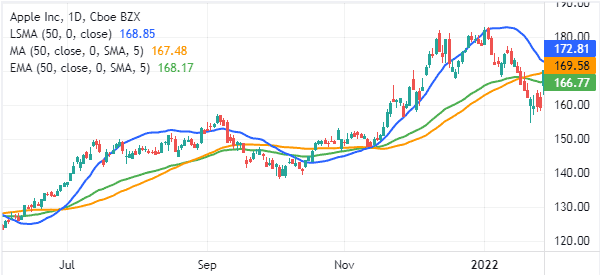
The chart below shows a stock with the 50-day LSMA and the 50-day EMA and SMA.
How is the LSMS calculated?
Calculating the least squares moving average is a bit complicated than other types of averages. The first stage of doing this calculation is to find the least squares regression line over the preceding period.
In other words, it calculates what the value would be if the regression line of the asset continued. Below is the formula of the LSMA indicator.
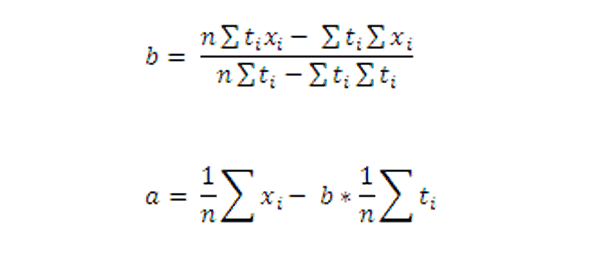
In this case, x is the price while t is the time of the asset. Finally, in is the period. Therefore, the LSMA indicator is calculated as:
| LSMA = b * t + a |
Difference between Least Squares Moving Average with SMA
The SMA and LSMA indicators are significantly different even though they seel to solve the same issues. For example, the SMA is calculated by adding the closing prices and then dividing them with the period.
As shown above, the LSMA indicator usually has a complex calculation process that involves finding the line of best fit. As shown below, the simple moving average has a bigger lag than the LSMA. Therefore, using the LSMA is a better and easier approach.
Strategies
Ideally, the Least Squares Moving Average is used in a similar way to other moving averages. The concept is always the same. Let’s see some of these strategies.
Moving average crossover
One of the most popular trading strategies is known as a moving average crossover. The idea behind this is simple. You use two MAs of different lengths and find areas where they make a crossover.
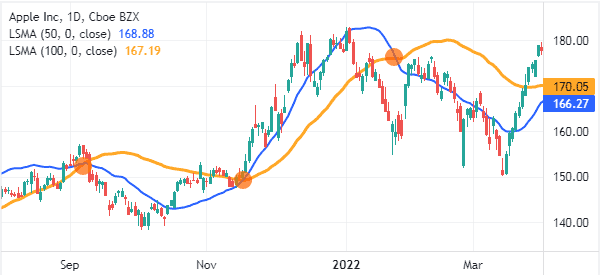
For example, you could use a 50-day and 100-day moving average in a chart. When they make a crossover, that can be seen as a bullish factor,
Two popular moving average crossover strategies are known as a golden cross and a death cross. In most cases, these strategies rely on the 200-day and 50-day moving averages. If the MA crosses at a lower price, it is often seen as a bullish sign and vice versa.
The 200-day and 50-day moving averages are often used by long-term traders. Instead, day traders and swing traders use a shorter timeframe when making decisions.
» Related: 1 minute scalping strategy
Using LSMA in trend following
Trend following is a trading strategy where traders seek to buy and hold assets as long as they are in an upward trend. The concept is based on the Newton’s Law of Motion that states that an asset’s price will remain in the same direction until it finds an equal opposing force.
Therefore, you can use the LSMA indicator to determine when a crossover is about to happen.
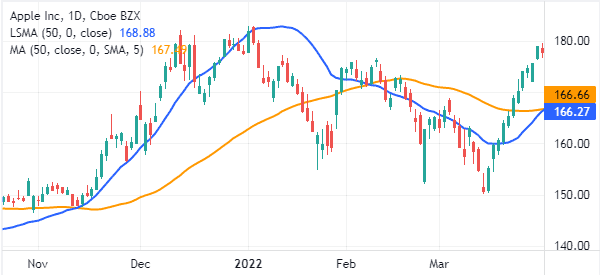
The chart below shows the Apple share price in an uptrend. In this case, the stock remained in an uptrend as long as it was above the moving average.
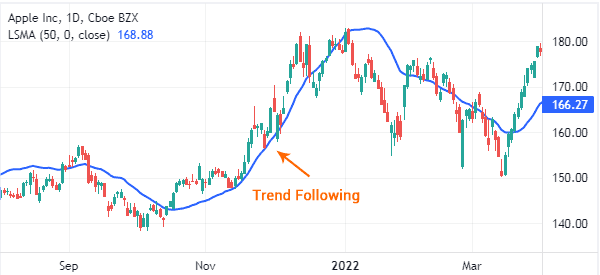
Therefore, you could have held the stock and exited it when it made a bearish crossover.
Using LSMA with other indicators
Another approach of using the LSMA involves using it with other technical indicators like the Relative Strength Index (RSI) and the MACD.
LSMA is a trend indicator while these others are oscillators that are mostly used to find overbought and oversold levels. They can also be used to confirm new trends.
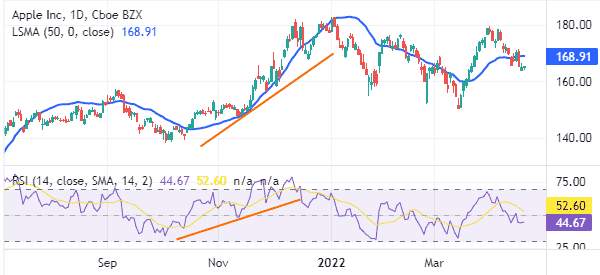
For example, in the chart below, you see that the Relative Strength Index was in an upward trend when the LSMA indicator was also rising. This can be a sign that the bullish trend is intact,
Pros and cons of LSMA
There are several benefits and cons when it comes to using the LSMA indicator.
Pros
- The indicator is more responsive than other types of moving averages.
- It can be used to find reversals easily.
- It is an ideal indicator when it comes to trend following.
Cons
- The indicator is seen as being more complex than other indicators.
- It is hard to find trading signals using the indicator.
Summary
In this article, we have looked at what the least squares moving average is and identified some of the most popular strategies to use. We have also assessed some of the best advantages and disadvantages of using the indicator.
External useful resources
- Least Square Moving Average: How to analyze the direction of the financial market using LSMA – Write.as
