Level 2 is an important data that experienced traders use to check the order flow in the stock market. In fact, some advanced traders avoid technical analysis altogether and focus on level-2 data to determine whether to buy or short a stock.
In this article, we will look at what level 2 data is and how you can use it to make trading decisions.
What is level 2 quote
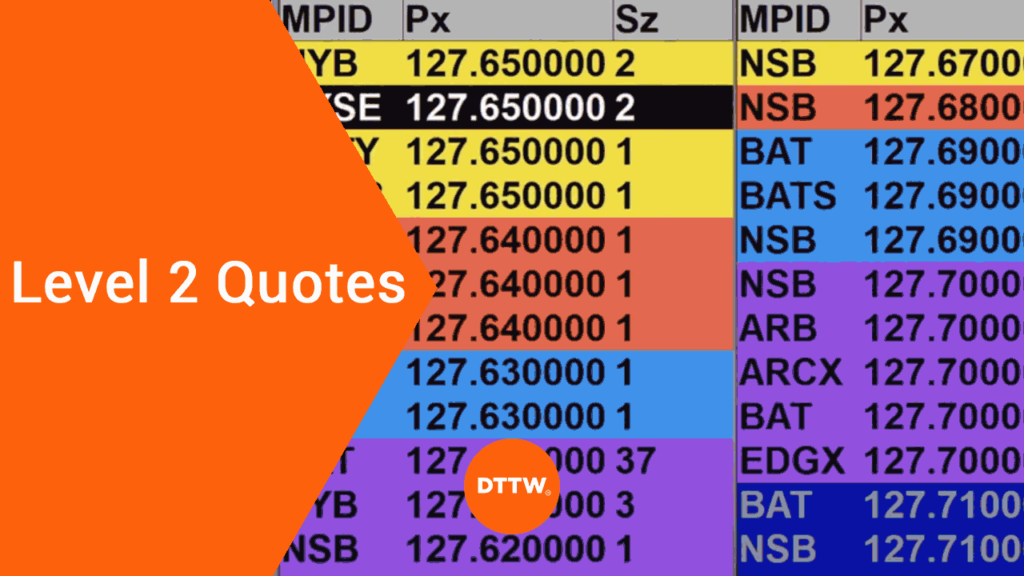
Level 2 is often viewed as a complex dashboard that shows the order flows in the market. It shows how buyers and sellers are placing their trades.
Depending on the broker, level 2 data shows at least five of the best bid and ask prices. They also show the market maker who is offering the price.
Having a good understanding of how to read level 2 market data can help you determine whether to buy or sell stocks.
For starters, a market maker also known as a wholesale is a company that provides liquidity in the stock market. When you execute a buy or sell order in a broker like Robinhood and Schwab, they usually route these orders through market makers.
The most popular market makers in the industry are Virtu Finance and Citadel Securities. Further, level 2 also shows the time when the orders were added by the two sides.
How level 2 data works
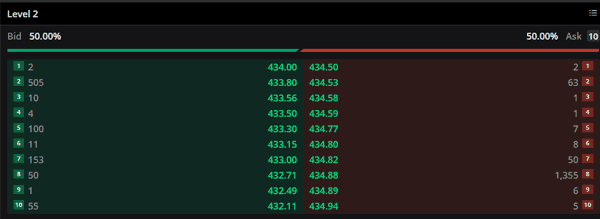
A good example of how level 2 data works is shown below. As you can see, on the left side, there is a buyer who is willing to buy 2 shares at $454.00. On the right side, there is a seller who is willing to sell 2 shares at $454.50.
Therefore, the work of the market maker, in this case, will be to settle the trade for the two participants.
Bid and Ask Price
The left side of Level 2 is known as the bid price. Bid refers to people who are trying to buy a stock. In most cases, it is usually red in colour, as shown in the chart below. It is usually arranged in a descending order, with the biggest bids on top.
The right side, on the other hand, is the ask price. It shows the number of people who are attempting to buy the stock and is usually arranged in an ascending order.
The level 2 dashboard is offered by several brokers and other online companies. At Real Trading, we provide this dashboard in the PPro8 trading platform.
Level 2: partecipants
There are three key parts of level 2 dashboards.
- Market makers – A market maker is a company that operates in an exchange to provide liquidity. They provide the quotations and are required by the exchanges to buy when no one is buying and sell when no one is selling. By doing this, the market makers help to ensure that there is good order flows in the market.
- Electronic Communication Network (ECN) – ECNs are communication networks that offer order placement systems. There are many online brokers that offer the ECN model.
- Wholesalers – This is a situation where many online brokers share their order flow to wholesalers who them execute the orders.
Level 2 and Time and Sales
The concept of level 2 is usually related to that of time and sales, also known as reading the tape. As we wrote before, time and sales shows all transactions in the market, including volume and the time the transaction went through.
In most cases, the time and sales is usually shown in red and green. The figures are red when they are executed at or below the best bid on level 2. If the price is executed at or above the ask price.
For example, if there are more greens in the time and sales, it shows that there are more buyers in the market, which is likely to push the price higher. Similarly, if there are more reds in the time and sales, it shows that there are more sellers in the market, which could push the price lower.
Benefits of Level 2
There are several benefits of using these quotes when trading. These are:
- It shows you exactly what is happening in the market. For example, you can understand exactly who is buying and selling the stocks.
- It helps you gain an edge against traders using the other types of analysis.
- As shown above, you can combine level 2 with time and sales and find imbalance.
Disadvantages of Level 2
However, there are disadvantages of using Level 2. For example, it is common for market makers to hide their order sizes using an ECN. They can also pump a stock and then dump it.
There are other disadvantages of using level 2 data. For example, this data is not useful for long-term traders or investors. Ideally, the differences in pricing in level 2 is usually minute. As such, those small movements don’t have a major impact on how an asset price will trade in the long term.
Second, level 2 is not available in some of the most popular financial assets. For example, it is usually not available in assets like forex and CFDs. These assets don’t use market makers. Instead, they use electronic communication networks (ECN) that don’t have level 2.
Third, level 2 data is not available in extended hours. In most periods, extended hours usually uses ECNs, which don’t provide these capabilities.
Finally, level 2 can be a bit difficult for many new traders to understand how to use it.
Level 2 vs Level 1
A common question is on the difference between level 1 and level 2 data in the market. Level 1 is similar to that data with the only difference being that it is not advanced.
Some brokers don’t provide time and sales data with level 1 data. Also, level 1 data shows the best bid and ask prices of an asset while level 2 shows at least 10.
Level 2 Trading Strategies
There are several trading strategies when trading the market. The most popular is to look at the charts and analyze where the price will move to.
On the other hand, there are those professional traders who look at the level 2 charts and attempt to digest what the market participants are doing.
Instead, in this article we have outlined how you can use level-2 data to give your strategies an extra boost.
Some of the top level 2 trading strategies are:
Scalping
Scalping is a trading strategy where a trader seeks to take advantage of small market moves. It involves buying and holding assets for a short period and then exit.
Using level 2 data can help you identify trends in order flows and then allocate your trades accordingly.
Breakouts
A breakout happens when an asset moves out of a consolidation phase or from a chart pattern. For example, if a stock is forming a symmetrical triangle pattern, it means that a breakout will happen when it moves to the triangle’s tip.
You can use the level 2 data to predict when the asset is about to have a breakout.
Combining with the time and sales data
Level 2 data is usually accompanied by time and sales, also known as reading the tape. You can combine the two data types to predict the next price action.
External Useful Resources
- Understanding level 2 quotes: Infographic – Stocktotrade
