A line chart is a straight line that connects a series of prices of a financial asset. It is also the simplest type of chart that you can see in a chart. In this article, we will look at what this particular kind of chart is, how you can use in trading and some strategies you can use, focusing more on price action.
What is a line chart?
A line chart (also known as line plot or line graph) is a simple type of chart that is mostly used to show an asset’s price or, rather, a graphical representation of an asset’s historical price action. The chart is drawn by connecting a series of prices like open, close, high, and lows, also known as OHLC, and it is very useful to spot the formation of a trend.
So graphically it is the simplest type of chart.. but its use is more complicated than you might think. In fact some very important information (such as some patterns) are omitted in the analysis phase.
How it is formed
The line chart is the simplest chart to form. It is simply formed by connecting the prices of an asset. For example, if a stock closed at $25, $26, $25, $28, $27, and $30, the chart will be created by connecting these lines.
This is unlike other charts that take more into consideration. For example, candlesticks consider the open, closing, high, and low points of a chart.
Other types of charts
In addition to the line chart, there are other types of charts used in the financial market, which we have looked at before. These are:
- Candlesticks
- Kagi
- Bar charts
- Heikin ashi
- Renko
- Point & figure
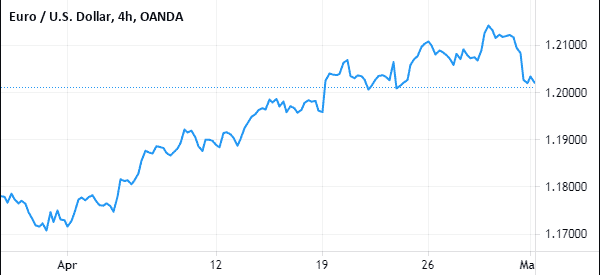
among others. The chart below shows a line chart applied in the EUR/USD pair.
How to analyze stock with line chart
Unlike other charts that we have looked at before, the line chart is not a useful chart when trading. In fact, very few day traders use it in day trading. That’s because the chart tells very little. Still, there are several strategies you can when using the chart.
Let’s see what is the best setup and the most useful indicators to use in the analysis phase.
Price action trading with line chart
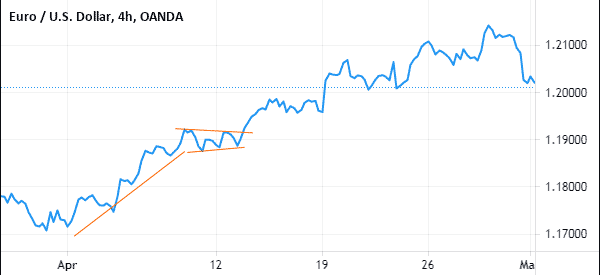
It is possible to identify chart patterns when using a chart with a simple line. For example, in the chart below, we have created an ascending channel pattern on the EUR/USD 4H chart by joining the upper and lower swings. Therefore, the pair broke out below the lower side of the ascending channel.
This was a bearish breakout pattern, which means that the price will likely continue dropping, in the near term.
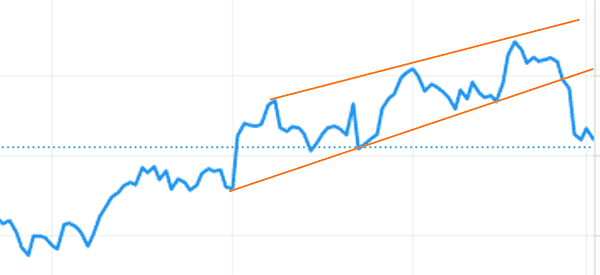
Still, while such a pattern is easy to identify in a line chart, it is much better when you are using a candlestick, as shown below.
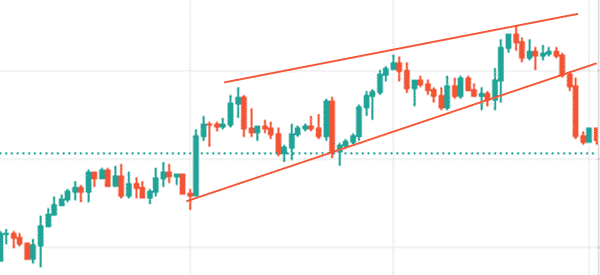
You can also identify patterns like bullish and bearish flags when using line chart. A bullish flag is usually a bullish continuation pattern while a bearish flag is a bearish continuation pattern. This simply means that when there is a bullish flag, the price will likely break out higher, and vice versa.
The chart below shows a bullish pennant formed on the EUR/USD pair.
Using line graphs with moving average
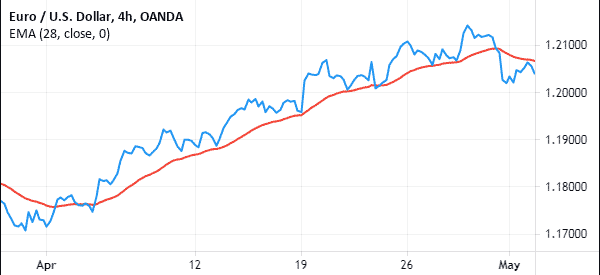
Another trading strategy you can use when using line charts is using a moving average. A good way to approach this is to use it in trend following. This is where you add a moving average and work to identify when a reversal is about to happen.
In a bullish trend, the pair will typically keep rising so long as the price is above the selected moving average, as shown below.
Limits of line chart
While a line chart is usually easy to identify, using it is a relatively difficult one to use in day trading. This is because this chart misses key points that are useful in sending signals.
For example, it is difficult to use it to identify some chart patterns that can only be seen in candlesticks. For example, bullish and bearish flags, and head and shoulders patterns are difficult to see.
Equally, some candlestick patterns like hammer, doji, and engulfing patterns are impossible to identify. As such, when using stock line graphs, you will likely miss some trading signals.
It also does not show several details like open, close, high, and low. For example, when you look at a candlestick chart, you can tell these details easily.
Final thoughts
A line chart is a popular chart that many day traders use to identify the overall movement of a chart. However, as experienced traders, we recommend that most new traders focus on other chart patterns like a candlestick, bar chart, and Renko to trade.
What is the type of chart you use the most?
External Useful Resources
- How To Trade Linecharts To See The Obvious – Tradeciety
