The S&P 500, Nasdaq 100, Dow Jones, and Russell 2,000 are the best-known market indexes in the United States. The four provide important measure of how the overall stock market is doing. For example, the Dow tracks 30 companies in all sectors while the Russell tracks 2,000 small cap stocks in the US.
In recent months, a major challenge has happened, particularly in the S&P 500.
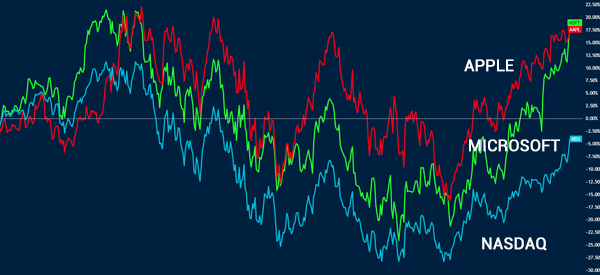
The challenge is that the index is dominated by a few large companies like Apple and Microsoft. As such, when the two firms are falling, the index will generally be in the red even if most other firms are in the green.
Therefore, it would be a nice thing if there was a way to measure how the overall stocks in the index are doing. Fortunately, there is!
This way is known as market breadth. In simple, market breadth refers to indicators that take a deep dive into the performance of the market and see the performance of specific stocks.
For example, it can identify the stocks that are at their 52-week highs or 52-week lows. They can also identify companies that are in the red or those in the green.
Why stock breadth is important
Stock breadth is an important measurement in the financial market because it gives you more details about the rally or decline. For example, it tells you whether there is indeed an overall rally or whether there are just a few companies that are driving the performance of the index.
For example, when the S&P 500 rallies because of big companies like Apple and Microsoft while most companies struggle, it is an indication that this is not a strong rally.
It is also a sign that there are fundamental issues in the financial market that you need to pay attention to. Most importantly, it means that a sharp reversal in the big tech names could pull the index lower.
Market breadth indicators can also tell you when a reversal is about to happen during a period of strong rally. Let us look at some of these breadth indicators.
Market breadth for stocks
A common question is whether it is possible to use market breadth indicators when trading stocks. The answer is that it is possible to use breadth and breadth indicators to trade stocks.
However, unlike other popular indicators like VWAP and moving averages, these indicators will typically not provide you with buy and sell signals.
Instead, the indicators will provide you with the overall sentiment about the market. For example, if most stocks are falling, breadth indicators will tell you that it is highly risky to buy a stock.
Market breadth vs volume
The concept of market breadth and volume are so important especially for stock traders. As mentioned above, breadth aims to look at the performance of stocks in relation to the broad market.
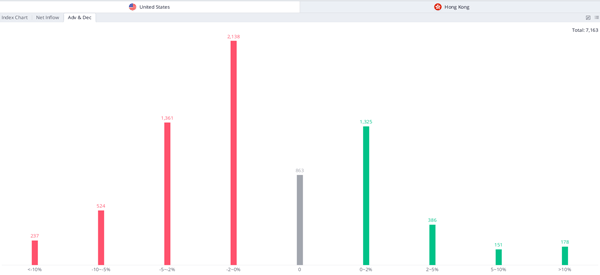
For example, you can look at the number of gaining stocks in the S&P 500 index compared to those that are falling. You can also look at the gainers and losers across the entire market.
A good example of this is shown below. As you can see, most stocks in the US were in the red at the end of May 2023.
Breadth, therefore, can inform traders when things are not doing well. For example, if a rally of the S&P 500 is rallying because of a handful of stocks, it means that there could be something fundamentally wrong with the broad market.
Volume, on the other hand, refers to the amount or number of shares that are traded in a trading session. The figure is useful since it shows how people are allocating their cash in a certain asset. For example, if a stock jumps with a low volume, it means that the rally will likely be short-lived.
Market Breadth Indicators
Advance-Decline Line (ADL)
The Advance-Decline Line is an indicator that looks at the number of gaining (advancing) line and subtracts the number of the falling (declining) stocks. The line will be rising when there are more companies that are rising than those falling. Similarly, it will be in the negative zone when there are more companies in the red compared to those in the green.
Traders use the advance-decline line (ADL) in several ways.
First, they use it as a way to assess the sentiment in the market. If it is rising, it is usually a signal to buy. When it is falling, it is usually a signal to sell. In other times, the ADL line can fall while the index is rising, which is a sign of divergence.
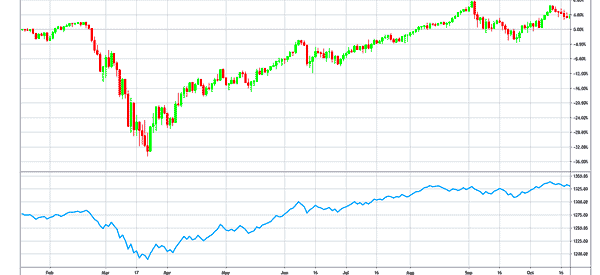
The chart below shows that the ADL line of the S&P 500 index dropped during the height of the pandemic. This happened since more shares were falling compared to those that were in the green. As the ensuing rally started, the ADL line continued to rise since more since more firms were rising.
Therefore, the ADL is a good indicator for long-term investors and swing traders. For day traders, it will not be as effective.
Cumulative volume index (CVI)
The Cumulative Volume Index (CVI) is relatively similar to the advance-decline line (ADL). The only difference is that the CVI looks at the volume coming in and out of the stock market. This indicator is calculated as following:
| CVI = Yesterday’s CVI + (Advancing Volume – Declining Volume) |
For example, if there are 175 advancing stocks in the S&P 500 and 87 declining stocks today, the CVI will be 88. If on the following day there are 132 advancing and 129 declining stocks, the CVI will be 91. That is 88+3.
The CVI is also similar to the On-Balance Volume (OBV) indicator. The only difference is in how the two uses volume. The CVI uses the exact volume while the OBV assumes that all volume is up when the stock closes higher.
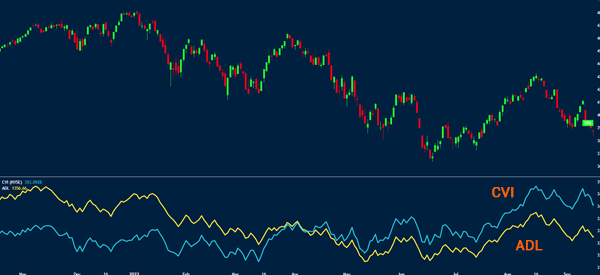
The chart below shows the performance of the S&P 500 when charted with the ADL and the CVI. AS you can see, the two indicators are usually similar.
Arms Index
The Arms Index is a technical indicator that is also known as TRIN. TRIN stands for Trading Index. The index uses both the advance-decline ratio and the advance-decline volume ratio.
These numbers are usually got from the main index providers like the New York Stock Exchange (NYSE) and Nasdaq.
The index is calculated using the following formula:
| (advances/declines)/ (Advancing Volume – Declining Volume) |
Advances and declines are simply stocks in an index that are rising and falling while advancing and declining volume refers to the total volume of rising and falling stocks.
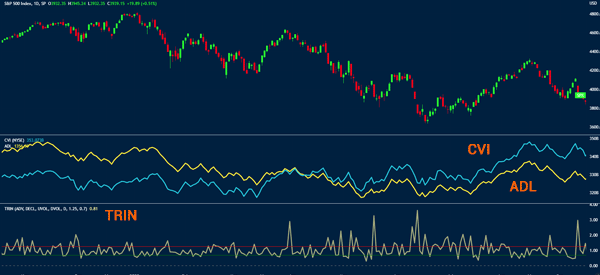
In general, when there is a major rally, the TRIN reading is usually low because the up volume tends to overwhelm the down-volume. Similarly, the TRIN value is negative when there is a major downward trend, as shown below.
There are other breadth indicators you can use, including the S&P 500 200-day index, accumulation/distribution, Mcclellan Oscillator, and the New Highs-Lows Index, among others.
External Useful Resources
- Breadth of Market Theory Explained – The Business Professor
