The Marubozu candlestick pattern is a candlestick pattern that looks like a block, meaning that it does not have any wicks (Marubozu, in Japanese, means “bald head” or “shaved head”). It is a relatively unpopular pattern but one that works relatively well when it is spotted.
In this article, we will look at what the Marubozu candle is and how you can use it in day trading.
But first, we need to briefly take up the concept of Candlestick. This is critical to understanding the use of this candlestick pattern.
Candlestick Patterns
For starters, candlesticks are the most popular types of charts in the financial market. They were developed centuries ago in Japan, where they were popular with rice traders. Today, they are used by most traders because of the vast amount of information that they produce.
A single candlestick can tell you the opening, high, close, and lowest (OHLC) levels of an asset. This is important since other charts like line charts only give you the closing or opening prices.
Candlestick patterns are unique arrangements that emerge when you look at a chart. Some of the types of candlestick patterns that we have looked at before are bullish and bearish engulfing, doji, evening and morning star, and hammer, among others.
Some of these candles are usually signs of a continuation while others are signs of reversals.
Also, for starters, candlesticks have two main parts. In most cases, they have a body, which is usually red or green in color. Some candles like the Doji don’t have the body. Second, a candlestick has a wick, that is also known as a shadow. Most candlesticks have an upper and lower wick.
What is the Marubozu candle?
With this knowledge, let us narrow it to what this particular candle is. Marubozu – we told you Above – is a Japanese word that means a bald or shaved head. This candlestick pattern is known well for its lack of an upper and head shadow. This means that the asset’s price opened at a high and closed at a low point and vice versa.
As a result, unless in highly calm markets (and with low volatility), this is usually not a popular candlestick.
However, there are a couple of very useful things you can understand from using this pattern in technical analysis. First, its formation indicates that a stock has been trading strongly in one direction (bullish or bearish, we’ll see in a moment).
Also, the Marubozu candle can provide some useful insight to predict the future direction of the price of a stock (obviously to be confirmed by combining other tools).
Bullish Marubozu candle
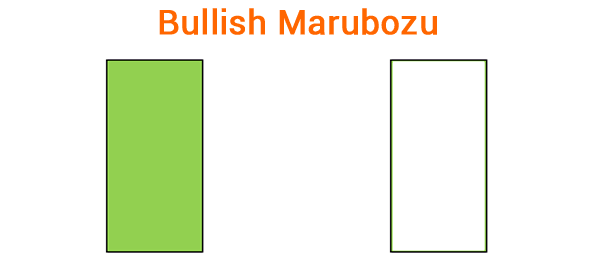
The Bullish Marubozu candle implies that the price opened at a lower point and then closed at a higher point. This happen because buyers controlled the price of the stock. The image below shows a bullish Marubozu pattern. It is also known as Marubozu white.
Bearish Marubozu candle
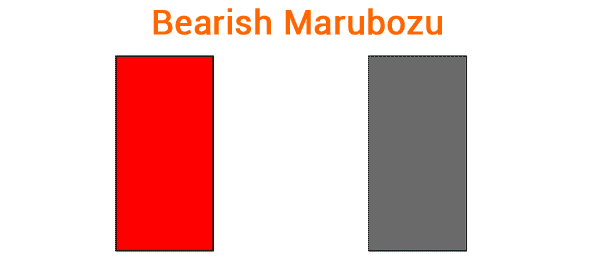
The bearish Marubozu implies that the price opened at a higher point and then closed at a lower level. In this case, sellers controlled the stock price. The image below shows the bearish Marubozu candlestick. However, the colors of these can change depending on how you have arranged your charts. It si also known as Marubozu black.
How to trade using the Marubozu candle
As mentioned, Marubozu candles are not very popular in the market. However, when they happen, it is usually a show of strength. In this case, when a bullish Marubozu happens, it means that bulls are still strong and are resisting any pressure by short sellers.
Therefore, in most cases, the bullish Marubozu tends to lead to a continuation of the upward trend.
On the other hand, a bearish Marubozu candle is usually a sign of the strength of bears. When it happens, it is usually a sign that the bearish trend will continue.
However, there is generally no standard accepted principle about this. This is because, at times, a Marubozu candle will lead to consolidation or even a reversal. A good example of this is shown in the chart below.
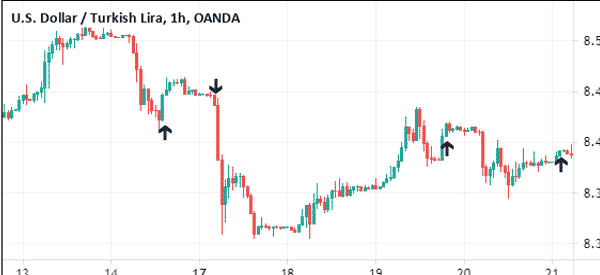
Let us look at the four highlighted candles. On the left side, we see that there was a bullish Marubozu candle that led to a small rally and consolidation. It is then followed by a bearish candle that led to a sharp decline of the asset price. The other two Marubozus led to consolidation.
Therefore, this shows that it is a relatively difficult thing to predict the next moves after a Marubozu candle. That’s why we said before that it is necessary to verify signals with other tools.
Marubozu trading strategy
As shown, it is a relatively difficult thing to predict what will happen after a Marubozu candle. This is unlike other candlestick patterns like doji that are well-known for their reversals.
By the way, there are two main ways you can remedy this challenge.
First, you can use the Marubazu to complement other trading strategies. For example, you can use it together with other tools like indicators, chart patterns like triangles and rectangles, and Fibonacci retracement.
Second, you can embrace a multi-timeframe strategy that we looked at before.
Summary
The Marubozu candlestick pattern is a relatively unpopular pattern used in the financial market. The pattern tends to be relatively tough to spot since it rarely forms. We have also looked at some of the precautions you need to take when you are using it and how to use it well in the market.
External useful Resources
- Marubozu Candle Stick: Trading Example – Learn Stock Market
