Volatility is one of the most useful aspects traders watch. There are those traders who prefer trading in a highly-volatile market and others who like to trade when the markets are calm.
Traders use a number of tools to know whether the market is volatile or not. There are those who use the CBOE volatility index (VIX). Others use various volatility-based indicators.
Some of the most common volatility indicators are the Bollinger Bands, momentum, and the triple exponential moving average.
In this report, we will look at the Mass Index, which is a well-known volatility index.
What is the Mass Index?
The mass index was developed by Donald Dorsey, who published about it in the 1980s. The index aims to look at the repetitive market patterns. Its goal is to identify when the trading range of an asset narrows or widens.
As such, the indicator is useful in identifying trends and reversals. The indicator is better used when the price of an asset is either moving upwards or downwards.
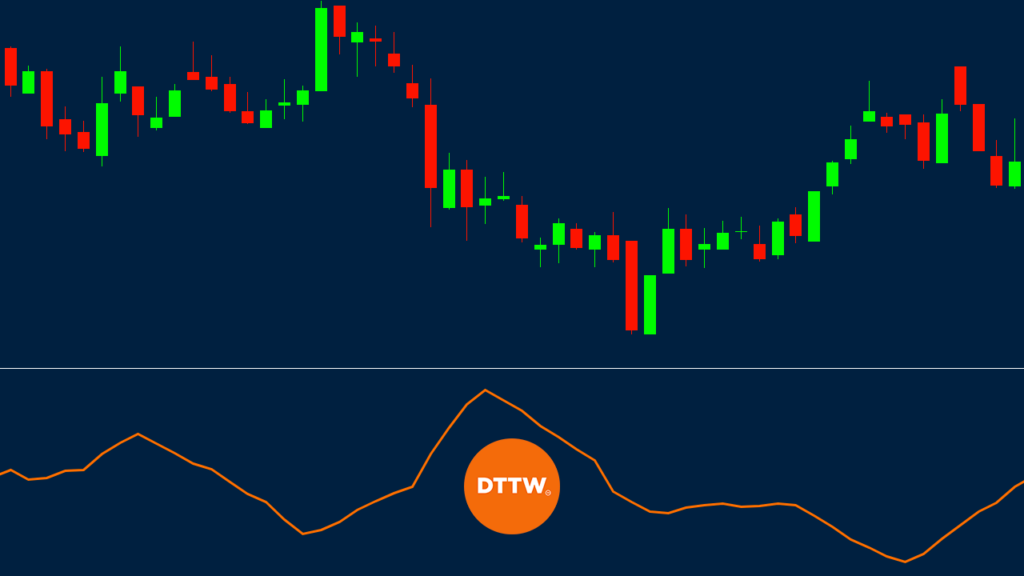
When it is applied on a chart, the mass index appears as a line that is similar to that of the RSI or the Accumulation/Distribution indicator. An example of this is shown on the chart below.

How it is Calculated
The mass index indicator is not difficult to calculate. However, as with other indicators, it is not a must for you to know how to calculate the indicator. Instead, you should focus on the parameters and knowing how to calculate it.
There are four stages of calculating the mass index:
- You should calculate the single exponential moving averages. You do this by calculating the 9-day EMA of the high-low differential.
- Calculate the double EMA of the high and low differential.
- Calculate the EMA ratio by dividing the two previous results.
- Finally calculate the mass index by calculating the 25-sum of the EMA ratio.
In general, this index rises when the high-low range widens. It falls when the range narrows.
A summary of how the mass index indicator is calculated is shown below.
| MI = SUM (EMA (HIGH – LOW, 9) / EMA (EMA (HIGH – LOW, 9), 9), N) |
How to Trade with Mass Index
When thinking of the index, Donald Dorsey hypothesised came up with two numbers. 27 and 26.5 are the most important numbers according to Dorsey. He said that a reversal happens when the index rises above 27 and then moves below 26.5. He called this situation a reversal bulge.
»Strategies to trade Reversal Patterns«
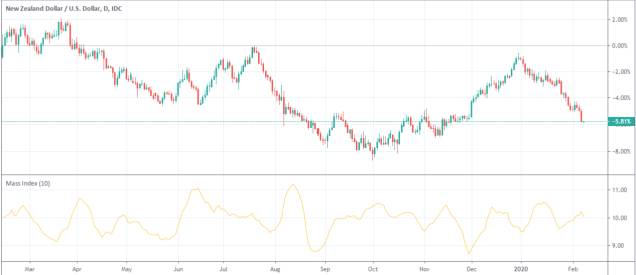
As such, a reading of 27 usually shows that the market is volatile while a number below 26.5 is usually a sign of low volatility. A good example of this is shown on the chart below. The default period in a Mass Index indicator is 10. However, analysts recommend tweaking this period to fit your trading strategy.
As you can see, the EUR/AUD pair moved lower after the indicator formed a reverse bulge.
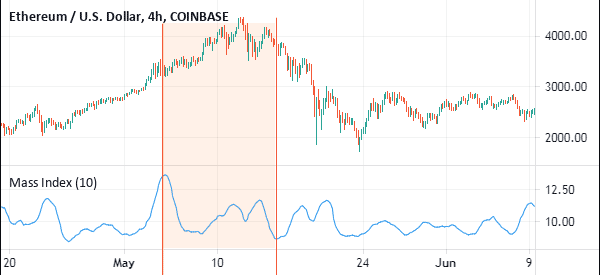
However, as you will find out, the Mass Index tends to send some wrong signals most times. For example, in the chart below, we see that the index rose sharply on May 5, 2021 when Ethereum price was rising.
As you can see, instead of the cryptocurrency’s price falling, it continued its bullish trend. Similarly, the indicator also declined on May 15th. Instead of bouncing back, the currency continued with its downward trend.
Best set up
The mass index can be used individually. However, our experience shows that it is better used in a combination with other indicators.
Some of the additional indicators that you can use with it are moving averages, envelopes, and the Ichimoku Kinko Hyo. This is because these indicators are primarily trend indicators.
You can also use it in combination with other oscillators like the Relative Strength Index (RSI) and the MACD.
Benefits of Using this indicator
The mass index is not a popular indicator. You will also not hear it being talked in popular television shows or talked about in popular trading books. However, it is a good indicator when you want to identify reversals in the market.
Second, the indicator is relatively easy to calculate. However, as mentioned above, this is not a mandatory thing to know.
Third, the indicator is found in most trading platforms. You can also install it on the MT4 by going to the marketplace.
Final Thoughts
The mass index has been in use for decades. Still, it is not a popular indicator. This should not discourage you from using it in the market.
To use it well, you need to learn more about it. Most importantly, you can test it using a demo account.
External Useful Resources
- 3 Ways to Spot Trend Reversals with the Mass Index – Tradingsim
- Learn more about this Indicator in Stockcharts
