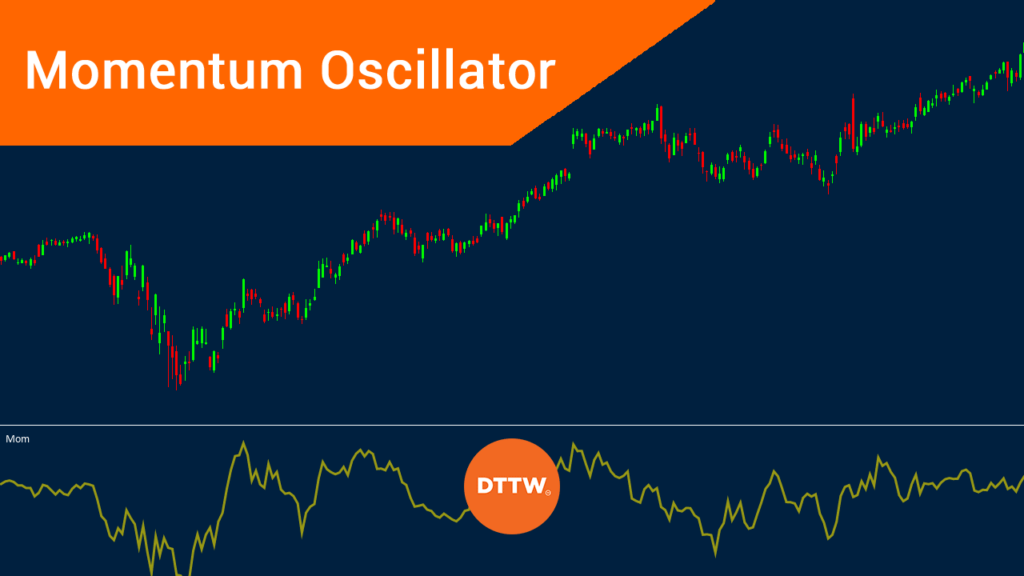
Momentum indicators are technical tools that show traders the rate of change of a financial asset in a certain period of time.
There are several well-known momentum indicators like:
- the Chande momentum oscillator
- moving average convergence and divergence (MACD)
- average directional movement index (ADX)
- DecisionPoint Price Oscillator (DPO)
- the Relative Strength Index (RSI).
In this article, we’ll look at the momentum oscillator and highlight how you can use it in day trading.
What is the momentum oscillator?
The momentum oscillator is an indicator provided by most trading platforms like the TradingView and the MACD. When applied, the indicator is visible as a line that ranges between 0 and 100, that moves up and down. Many traders, however, add another line to denote the midpoint.
In summary, the momentum oscillator measures the amount that a security has changed in a certain period over a certain period. The chart below shows the momentum oscillator applied on the daily chart of Monster Beverage stock.
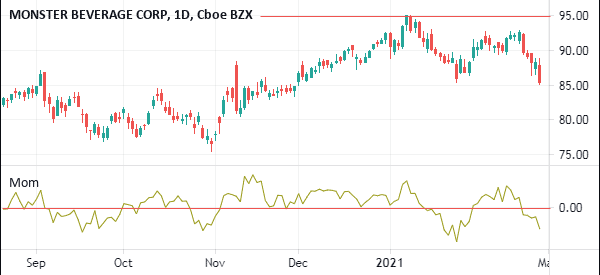
As you will note below, while the momentum oscillator is an important one, it does not reveal clear signals. It has no overbought and oversold levels. Therefore, it is used better in combination with other indicators like the RSI and moving averages.
Related » The Momentum rule in day trading
How to calculate the MOM
The momentum oscillator is a relatively easy one to calculate. However, like all indicators, calculating is not necessary since it is provided by default by many platforms. All that matters is applying the indicator in a chart and interpreting it.
As mentioned, the momentum indicator weighs the closing price of an asset to another closing price that is depicted as “n.” The “n” period is determined by the trader but the default in most trading platforms is usually 10, to depict the two-week trading period for stocks.
However, as in all technical indicators, you can tweak this based on your strategy.
The formula for the momentum oscillator is:
| M= (CP /CPn) X 100 |
where CP is the closing price.
Let’s use this example: If the CP of a stock is at $100 and the CPn is 95, then the momentum oscillator figure is 105.
How the momentum oscillator works
The momentum oscillator works in a relatively simple way. In most cases, when it rises, you should assume that the trend will continue.
In most cases, traders draw a line in the middle to depict where a turnaround may happen. This figure is usually 50 or zero, depending on the platform. Some traders also view the extremes of the indicator as being the overbought and oversold levels.
Related » How to Spot trends early!
According to John Murphy, who created the MoM indicator, it showcases the difference between two prices of an asset. It shows the most recent closing price and relation to a previous closing from a given time range.
In this case, if an asset’s price was trading at the same point for 20 days, then it means that the indicator’s level will be zero.
On the other hand, if the price today is higher than it was 20 years ago, it will plot it above zero. Additionally, if the price is lower today than it was in the preset period, it will be below zero.
Taken together, the momentum indicator usually rises when an asset makes large price moves and then falls when the price changes with small jumps.
How to use the momentum oscillator
Using the MOM is a relatively easy process. First, you need to find it on your trading platform. If you are using the MetaTrader, you can find it in the oscillators section of indicators. On the other hand, if you are using the TradingView, you can use the inbuilt one by using the search box.
Alternatively, you can use those in the public library, meaning that they have been built by the platform’s users. Some of these indicators are the momentum acceleration, momentum divergence, momentum adjusted moving average, and the price momentum oscillator among others.
When using those in the public library, you should take time to read the scripts to see the specific details.
Mid-point line
The first method of using the momentum oscillator is to look at its mid-point. To do this, you should just draw a line at the middle point, which, as shown above, can be 0 or 50.
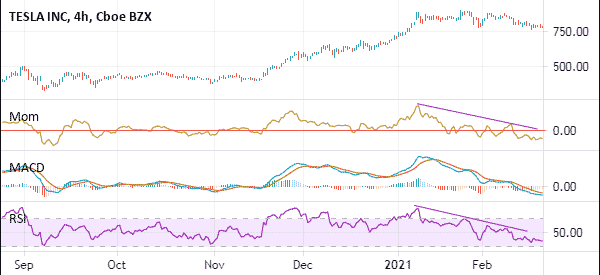
In an uptrend, if the price remains above this midpoint, it means that there is enough momentum to keep it going higher. On the four-hour chart below, we see that the Tesla shares have remained above zero during their recent uptrend.
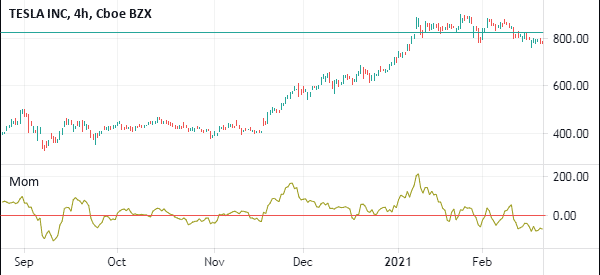
There are a few points to note in this.
- First, the momentum oscillator only works well when the price of an asset is trending upwards or downwards;
- Second, there are times during an uptrend when the indicator moves below the neutral line;
- Third, as you can see, the indicator does not necessarily produce specific buying and selling signals.
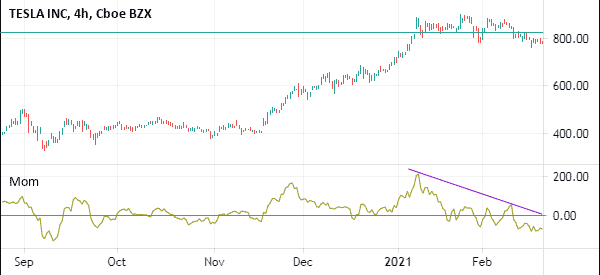
Using the MOM to find divergence
At times, the momentum oscillator is used to show divergence. For starters, this happens when, in an uptrend, the financial asset starts showing bearish signs. This is usually a sign that the rally is waning.
To do this, you need to join the upper side of the momentum oscillator. In case of a bearish trend, you should join the lower sides of the indicator.
A good example of this is in the Tesla stock shown below. As you can see, the overall trend of the momentum indicator is downwards. This is a sign that, at least in the near term, that the momentum has waned and that the stock could start falling or start consolidating.
Combining the oscillator with other indicators
The most useful strategy of using the momentum oscillator is to combine it with other technical indicators.
For example, you can combine it with tools like the Relative Strength Index (RSI) to find divergences or to find buying opportunities. Other useful indicators you can use are moving averages and the MACD.
The chart below shows the three indicators used to show bearish divergence.
Zero-line crossover
The momentum oscillator, like the MACD, has a zero line, which is extremely important. This line can be useful in determining whether to place a buy or short trade. The first step of using this approach is to add the momentum oscillator on the chart.
After this, you can change the length used. In most cases, chart platforms use the length of 10 days, which you can leave intact.
Therefore, if an asset’s price is rising, a trader will often open a buy trade when the momentum indicator rises above the neutral point. A good example of this is shown below.
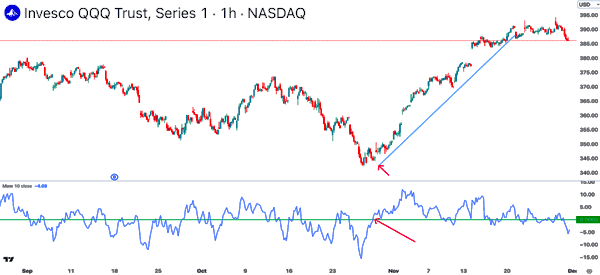
However, as you will find out, the biggest con of the momentum indicator is that it usually sends a lot of false signals.
As shown in the chart above, while the zero line crossover was a good one to identify the buying price, the indicator formed a bearish divergence pattern shortly afterwards.
Therefore, people who bought QQQ after the crossover likely exited the trade shortly afterwards. As a result, they missed the spectacular rally that continued shortly thereafter.
Summary
The momentum oscillator is a useful tool that can help you to identify buying and selling positions and divergence. We recommend that you first use it in a demo account to learn more about it.
External Useful Resources
- Momentum Versus Rate Of Change: Which Indicator Does The Job Better? – Commodity.com
