In the past few months, we have been on a journey to educate our members on technical analysis. It is a journey that has seen us cover some of the most popular indicators like the Relative Strength Index and other unpopular indicators like the Donchian Channel.
In this article, we will look at another popular indicator known as the Moving Average Convergence/Divergence (MACD) and how to use it in trading.
What is the MACD Indicator?
The Moving Average Convergence/Divergence (MACD) is an indicator that was developed by Gerald Appel in the 1970s. The indicator is found in most trading software like the MetaTrader (and in our PPro8™)in the oscillators category.
When applied in a trading chart, this indicator has two lines. The first line is usually the signal line while the other one is the main line. In other platforms, the main line is usually seen as a histogram.
The genesis
As the name suggests, the MACD is derived from moving averages. The moving average is one of the most common indicators in the world. It has also been used to create other indicators.
For example, the Bollinger Bands, an indicator we have covered before, has been developed using moving averages and standard deviation.
The Moving Average Convergence-Divergence indicator is a simple indicator that is developed by combining two moving averages and subtracting the longer one from the shorter one.
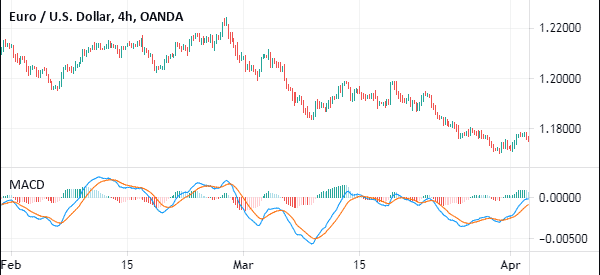
By doing this, the MACD forms a momentum oscillator from two trend indicators. The chart below shows the indicator applied on a EUR/USD chart.
How to Calculate it
As mentioned above, the MACD is calculated by first calculating the moving averages. As we have covered before, there are several types of moving averages. There are the simple, exponential, weighted, and smoothed moving averages.
In this case, the type of moving average that is used is the exponential average. This is because the EMA is usually weighted more towards the last closing price. As such, it tends to be more accurate than the simple moving average.
Therefore, the indicator is calculated using the following method.
- MACD Line = (12-day EMA – 26-day EMA)
- Signal Line = 9-day EMA of MACD
- Main Line = MACD line – Signal Line
The 9-day, 12-day and 26-day EMA are usually the default in most platforms. However, you can always tweak the periods depending on your trading strategy.
The MACD settings for day trading
The name tells it. The MACD stands for moving average convergence and divergence. As such, its goal is to find where the long-term and short-term moving averages converge and diverge.
Convergence is when the two averages move towards one another while divergence is when the averages move away from one another.
Another thing. When applied on a chart, the main line of the Moving Average Convergence Divergence oscillates above and below the centreline.
As such, a signal of the MACD indicator usually happens in three ways:
- It happens when the main line and the signal line of the MACD crosses the centreline.
- A signal happens when the two lines make a crossover
- It usually happens when the two lines are in extreme areas.
As a day trader, it is mostly recommended that you use the default settings provided by your trading platform. In TradingView, the default periods are 12, 16, and 9. 12 or the shorter period is known as the faster average while 26 is known as the slow average. This is because the faster-moving average is usually more reactive to price changes and vice versa.
Finally, the final smoothing number is calculated by identifying the difference between the fast and slow moving average.
There are two lines in the MACD line. First, there is the signal line, which is simply the moving average of the MACD. Second, there is the indicator line.
How to read and use the Moving Average Convergence Divergence
To use the moving average convergence divergence well, there are a few things you need to do.
Trending chart
First, ensure that the chart you are using is not in consolidating mode. A chart that is consolidating or moving in a sideways direction is not recommended. This is simply because when this happens, the short and long-term moving averages are usually the same.
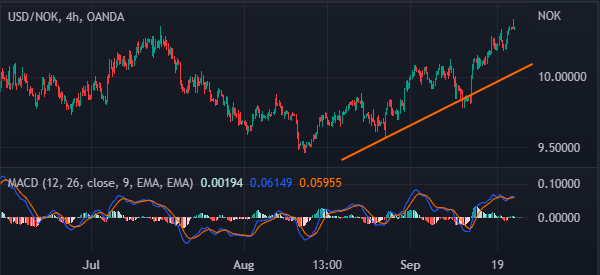
A trending chart is one where an asset’s price is either rising or falling continuously. On the other hand, a chart in a consolidation is one that is barely moving. A good example of an ideal chart to use with the MACD is shown below.
Check the imputs
Second, ensure that you check the inputs in the moving average convergence divergence. In most cases, the default inputs are 9, 12, and 26.
A good example of the MACD indicator at work is shown on the NZD/USD chart below. On this chart, look at the red and blue trend lines.
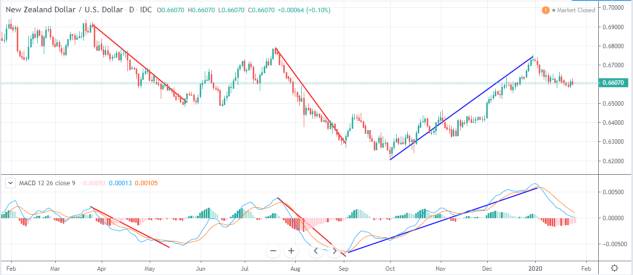
As you can see, a sell signal is usually indicated when the two lines are moving downwards while a buy signal usually emerges when the two lines are moving upwards. The most important period is when a crossover between the two lines happen.
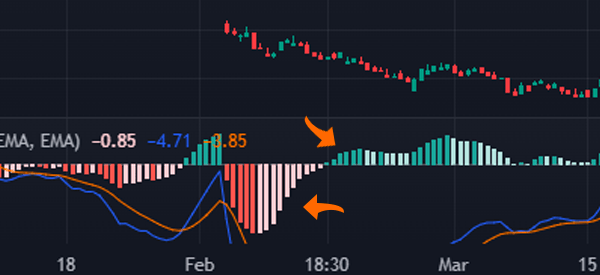
What is the MACD histogram?
Some MA convergence/divegence indicators usually come with a histogram. This histogram is usually the difference between the MACD line and the signal line. It usually shows the distance between the two lines.
As such, a bullish signal can be confirmed when the MACD line moves above the neutral point. A bearish signal, on the other hand, can be seen when it moves below the neutral point.
Strategies for Moving Average Convergence Divergence
MACD Crossover
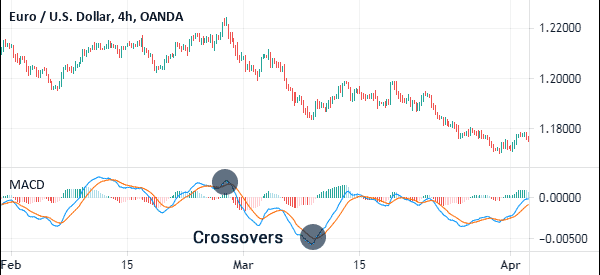
One of the most popular method of using this tool is to focus on the crossover between the two lines. Ideally, a buy signal comes up when the two lines make a crossover below the neutral line.
A sell signal comes up when there is a bearish crossover above the neutral line. A good example of this is shown in the chart below.
MACD and divergence
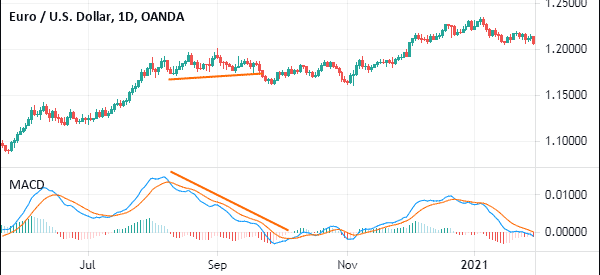
Another popular trading strategy when using it to identify divergence. For starters, divergence refers to a situation where the price of a currency pair or stock is rising while the MACD is trending higher and vice versa. It is a popular trading strategy when you want to identify whether an asset’s price is about to reverse.
For example, if an asset’s price is rising while the MACD is rising, it could be a sign that the momentum is fading and that the price will reverse. A good example of this is shown in the chart below.
MACD vs RSI
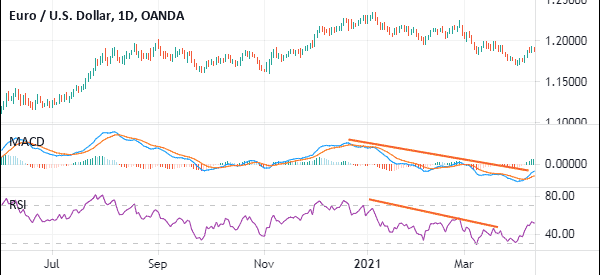
The MACD is often used together with the Relative Strength Index (RSI), which is also an oscillator. The RSI measures the speed of the recent changes and is a good indicator of overbought and oversold levels.
The best approach of using the RSI and the MACD is to combine them with the goal of confirming actions. For example, in the chart below, we see that the two indicators were early in predicting that the EUR/USD would start a downward trend.
MACD vs moving averages
A common question is on the difference between the MA convergence/divergece and other moving averages. There is a big difference. For one, MACD is an oscillator while other moving averages are trend indicators. As such, it can be used to identify support and resistance levels.
Another difference is that the MACD is derived from moving averages as shown above.
Summary
The MACD is one of the most popular technical indicators in the financial market today. It is also one of the easiest to calculate and use.
In this report, we have looked at who developed the indicator, how it is calculated, and how it is used in the financial market. We could have written a lot and shown examples of the indicator.
If you are just getting started using it, we recommend that you take your time to read more about it. Also, we recommend that you take your time to use the indicator in the demo account.
External Useful Resources
- Accuracy of MACD divergence for trading – The Balance
- How to Interpret the MACD on a Trading Chart – Dummies
