Technical indicators are essential when it comes to trading. Traders use indicators to project where the price of an asset will go to.
As we have written before, there are several types of indicators. There are oscillators like the Relative Strength Index (RSI) that show when a price of an asset is overbought or oversold. There are trend indicators that show whether there is a trend or when a reversal is happening.
In this article, we will look at the moving average envelopes.
What is the Moving Average Envelopes?
As the name suggests, this is an indicator that is derived from the moving averages, one of the most common type of indicator in the market.
The average used to calculate the envelopes can either be a simple moving average (SMA) or an exponential moving average (EMA).
The SMA is simply calculated by adding closing prices and dividing by the number of periods. An exponential moving average, on the other hand, is more weighted to the recent prices.
When applied, the envelopes can help identify reversals or even identify overbought and oversold levels.
How to Interpret the MAE (+ formula)
The moving average envelopes is a trend-based indicator. At the same time, because of the two lines that are derived, the indicator is a channel or oscillator-based. These indicators are usually designed to encompass price action.
As such, you should always look at when the price moves below or above any of the lines. Any move above the upper line is usually an indicator of strength. Similarly, any move below the lower line is also a sign of strength.
The envelopes are calculated by first getting the moving averages. After doing this, you set a certain percentage to below and above the moving averages.
Therefore, you need to first decide the type of moving average to use. We recommend using an exponential moving average.
After calculating the average, you should assign a percentage. The most common percentage is 25%.
Upper envelope: 14-day EMA + (14-day EMA x 0.025) |
Lower envelope: 14-day EMA – (14-day EMA x 0.025) |
How to Use the Moving Average Envelopes
This is relatively easy. First, you should identify a chart that is trending in either direction. You should not use it when the price of an asset is moving in a sideways direction.
Next, you should enter the period you want to use. The default period in most platforms is usually 14. You should also enter the deviation you want to use. The default in most platforms is usually 10%.
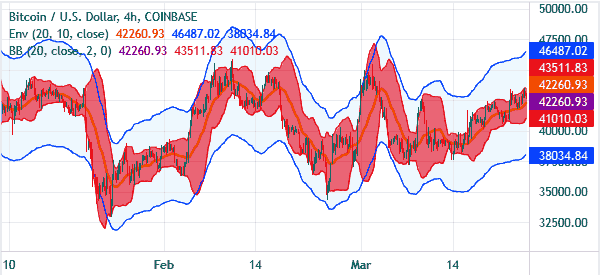
A good example of the moving average envelopes is shown below. The red line is the 14-day moving average.
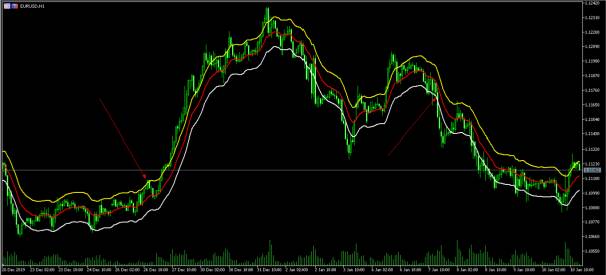
As you can see above, when the price moves above the yellow upper line, it usually a signal that the price will continue moving higher. The same is true when the price crosses the lower envelope.
There are other traders who use the two envelopes to identify overbought and oversold levels. However, this can be tricky as a price can remain in “overbought” and “oversold” levels for a continued period of time.
As such, it is tricky to short when the price tests the lower line and vice versa.
Day trading strategies using the envelopes
There are several trading strategies you can use when trading envelopes, including some of the following.
Trend following
Trend following is a trading strategy that involves looking at an existing trend and following it. The idea is that the price will continue in that trend until something important happens.
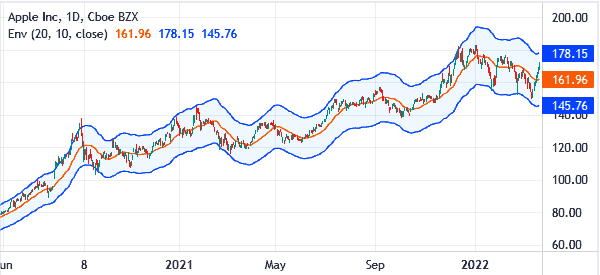
For example, in an uptrend, the asset will remain in an upward trend as long as it is between the upper and middle lines of the Envelopes.
Similarly, in a downtrend, it will continue in that direction as long as it is between the lower and the middle lines. A good example of this is shown in the chart below.
Reversals
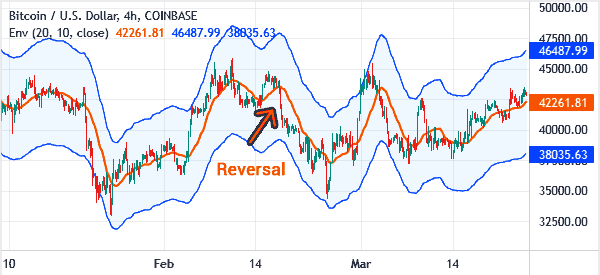
Another strategy is to use envelopes to find reversals. Trend followers are often more comfortable with this approach. The idea is to short an asset when it moves below the middle line of the envelopes indicator.
For trend followers, an exit point is usually when the asset moves below that middle line. A good example of this is in the chart below.
Overbought and oversold levels
The envelopes indicator is not an oscillator, meaning that it is a bit difficult to use it to find overbought and oversold levels. Still, it is possible to use the indicator to find out when an asset is getting overbought and oversold levels.
But to do this, it is recommended that you combine it with other indicators like the Relative Strength Index and the Commodity Channel Index. You can identify an overbought level when the indicator starts to deviates from the price when it is in an upward trend and vice versa.
Envelopes vs Bollinger Bands
A closer look at the envelopes indicator shows that it has a close resemblance to Bollinger Bands. And in fact, most traders use the two in the same way.
But there is a difference in that Bollinger Bands is made up of a moving average and standard deviations while envelopes is made up of a moving average and percentages of moving averages.
Drawbacks of MA envelopes
There are multiple challenges that people face when using envelopes. First, it is almost impossible to use the indicator in ranging markets. In this period, it will not send any good signals.
Second, envelopes can lead to false signals in the market. For example, you can assume that a buy signal has been triggered when the price moves above the middle line only for a reversal to happen.
Key Take-away
The moving average envelopes is an important indicator that is also easy to use.
While it is simple to use, we recommend (as usual) that you use it well, and combine it with other indicators. Also, we recommend that you take a considerable amount of time testing it.
External Useful Resoures
- Mae definition and analysis – Stockcharts
- Forex Trading Strategies With Envelopes Indicator – DolphinTrader
