As we have covered before, fundamental analysis such as data and news are very essential. The two help traders get information about the state of the economy.
As a result, they can use this information to predict how a currency or an asset will move. We have also covered technical analysis. This is a method where traders use indicators to trade.
In this report, we will look at the important concept of OHLC charts (one of the most common types of graph used in trading) and how you can use it to trade, exploring some useful strategies.
What is an OHLC?
OHLC is a short-form of Open, High, Low, Close. These terms are self-explanatory and you have likely used them before.
The open is the price which the asset started the day at. For example, if you are trading Apple, the open price will be where the price starts the day. This price is determined by the demand and supply of the asset at the start of the day.
High is the highest level the asset has reached. For example, if Apple opened the day at $100, rose to a high of $120, and then started moving downwards, then the high of the day will be $120.
As the name suggests, Low is the lowest price of the day. Finally, Close is the final price where the asset trades at. Japanese candlesticks and bar charts are popular types of OHLC charts.
What is not an Open High Low Close
A line chart is not an OHLC because it only shows the closing price of an asset. Similarly, points and figures, kagi, and renko are not OHLC charts because they usually remove the noise of time.
OHLC vs Candlesticks
A common question is on the difference between the OHLC and candlesticks. The two have similarities since a candlestick is a form of OHLC. For one, candlesticks have the four key parts: open, high, low, and close.
The difference between the two is that the OHLC usually shows the open and close via left and right horizontal lines. On the other hand, candlesticks do that through the body.
Forex and US OHLC problems
These concepts may sound easy. However, a closer look at them shows a few difficulties. For example, in forex, there are two main closes and open. There is the open price when the market opens on Monday and the close price when it shuts for the weekend on Friday.
The difficulty for finding these two is that the forex market is usually open for 24 hours every day. As such, it is difficult to ascertain the exact open and close prices.
There is also the same problem when you are looking at shares of companies listed in the United States. The problem is that it is very difficult for you to know the open and close prices because of the extended hours trading.
Extended hours are also known as pre-market and after-market trading. This is the trading that happens after the market closes and before it opens.
What Does OHLC charts mean?
As a trader, knowing the OHLC prices is a very important thing. It is important because it tells you the range of the assets within the day. This range can help you identify the amount of volatility in the market.
For example, if the open price of Apple is $100, its high is $101, the low is $99.5, and the close is $100, it means that there is no volatility in the stock. However, if the open is $100, high is at $110, low is at $95, and the close is at $115, it means that there is a lot of volatility on the company’s stock.
There are traders who prefer trading in a period of low volatility and others who prefer trading in a period of high volatility.
The three numbers are also important when you are applying indicators on the assets. When applying most indicators, you will often be asked to enter the price you want to use.
Most traders use the closing prices. Still, there are those who prefer using the open prices.
How to read and Apply OHLC Charts
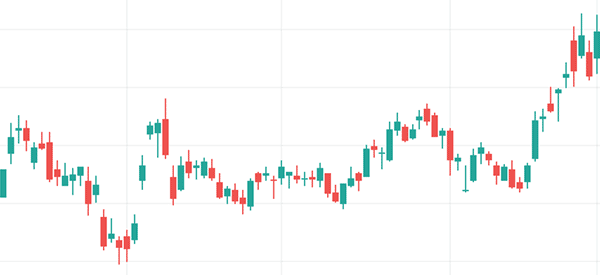
The simplest way to use the OHLC bar is to use the Japanese candlesticks. These are the most common types of charts.
This is easy because a candlestick is essentially an OHLC chart.
A candlestick has four main parts as shown below. The parts not shown below are the upper and lower shadows and the body. A candlestick on a daily chart represents the OHLC during the day.
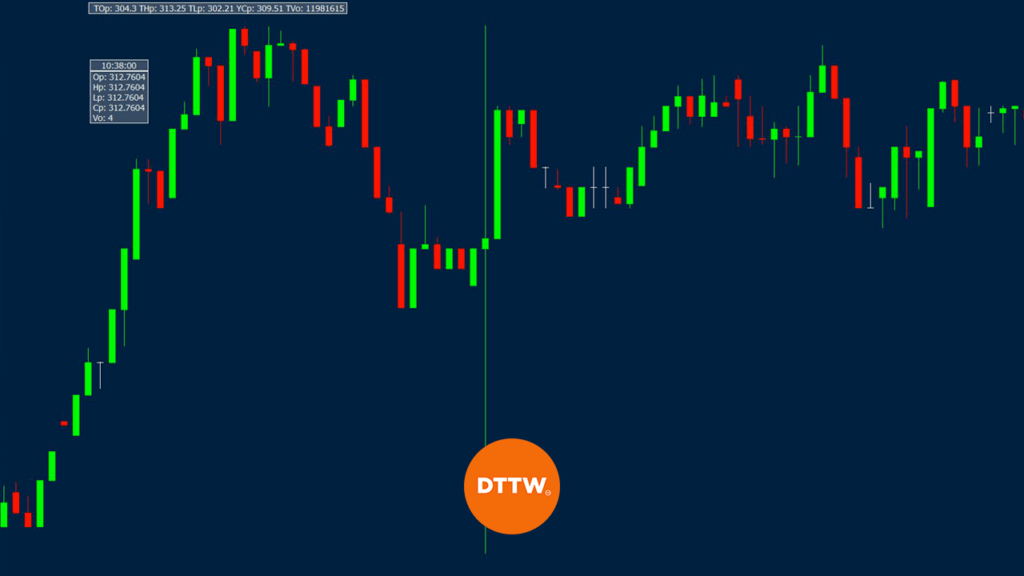
On platforms like MT4 and our proprietary Ppro8, it is easy to update the OHLC. You do this by simply going to the properties and selecting show Open-High-Low-Close. This will show you these numbers at the top part of the chart.
Alternatively, you can go to the marketplace and download it.
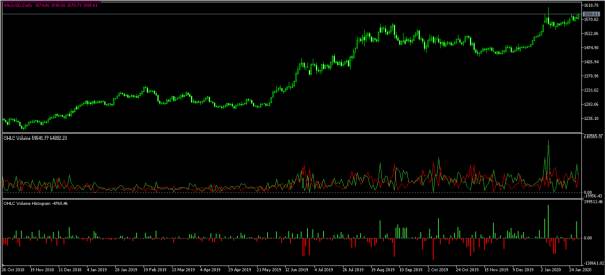
You can also download the OHLC volume and histogram. These three tools are shown on the chart below. The OHLC has been highlighted in pink.
There are other important parts of reading the OHLC charts. First, it is always important to look at the length of the chart. A long OHLC candle is usually a sign of the strength of the price movement.
For example, if a stock opens at $219 and closes at $209, it is a sign that the move was a strong one. People notice such moves more than if the stock opens at $219 and closes at $218.
Second, always look at the color of the OHLC candle. By default, the green color will be a sign that the asset jumped in that period. If it is green in a daily chart, it is a sign that the stock had a positive day. On the other hand, if the candle was red, it is a sign that it declined. You can change these colors to match your taste.
Further, you should look at the horizontal line positions. These lines tell traders where the asset opened and closed in comparison to its high and low price. In this case, if the price jumped but closed lower, one can assume that the asset jumped and then closed lower.
OHLC trading strategies
There are several day trading strategies when using OHLC bar charts. Broadly, the two main types of these strategies are technical analysis and price action.
Technical analysis is a trading strategy that uses charts and combines them with indicators. Indicators are based on mathematical calculations. Some of the most popular technical indicators used in analyzing OHLC charts are the Average True Range (ATR), Average Directional Movement Index (ADX), and the Relative Strength Index (RSI).
Price action, on the other hand, is the process of analyzing chart patterns with the goal of finding unique arrangements. The most popular of these patterns are bullish and bearish flags, bullish and bearish pennants, and triangle patterns.
Common OHLC patterns
One of the top benefits of using OHLC is that it has unique patterns that can help you predict the next price movement of an asset. These patterns are similar to those found in candlestick patterns.
First, there is a pattern known as doji, which forms when an asset opens and closes at the same level. This pattern is usually a sign of a reversal.
For example, if the pattern forms when in an uptrend, it is usually a sign that it is about to change. There are several types of doji candles, including dragonfly, gravestone, and standard.
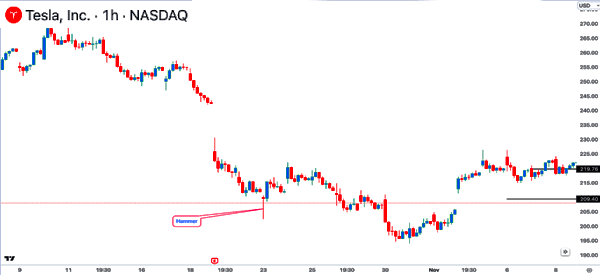
Second, there is the hammer pattern. As the name suggests, the pattern is characterized by a small body and a long lower shadow. Like the doji, this pattern is usually a sign that an asset is about to form a reversal. A longer shadow is usually a better sign than a shorter one. A good example of this is shown below.
Third, there is a pattern known as a morning or evening star. A morning star is a small candlestick that forms during a downtrend. It is also a reversal pattern. It is characterized by having a small body with small or no shadows.
The other popular patterns are bullish and bearish engulfing, harami, piercing line, three white soldiers, and hanging man.
Final Thoughts
Unlike other indicators like the RSI and moving averages, OHLC does not provide pointers as to where the price of an asset will move. Instead, it helps provide an indication as to how the assets are trading and the ranges to watch.
External Useful Resources
- How to create Candlestick (or OHLC) charts for share prices – The Data School
