Technical analysis is one of the two methods of analysis when it comes to financial trading. Fundamental analysis is involves looking at the economic, political, and macro events and analysing their impact on currencies and stocks. It is a good method that has had significant results over the years.
Technical analysis on the other hand is much simple because it involves using tools such as moving averages, relative strength index, and stochastic oscillator to predict the future prices.
These indicators are developed by using several mathematical calculations. There are several types of technical indicators.
In this article, we will look at On Balance Volume, which is not well-known by traders.
You may also be interested in understanding how to Master Technical Analysis, if your trading style involves the use of indicators.
What is On Balance Volume Indicator?
As the name suggests, On Balance Volume is a volume-based indicator. Volume indicators use the concept of volumes to help traders make better decisions.
On Balance Volume is an indicator that was developed by Joe Granville in 1963. He wrote a book known as Granville New Key to Stock Market Profits.
The indicator simply runs a total of positive and negative volume. A period is usually said to be positive when the close is above the previous close. It is said to be negative when its close is below the previous close.
To understand the importance of volume, you need to consider a simple example: suppose that the price of tomatoes went up suddenly when shoppers were not there. This price could go up, but it will likely come down as soon as more shoppers start to buy.
What does the on-balance volume indicator tell you?
The on-balance volume indicator tells you that the number of positive days are more than those of down days. As a result, it could be a sign that the bullish trend will continue for a while.
On the other hand, a falling OBV means that the volume of down days is falling. Therefore, it could be a sign that there are more sellers in the market than buyers.
In most cases, traders focus on the trend of the indicator instead of the absolute figure. Therefore, it is recommended that you fist look at the trend of the asset and then identify whether it matches with the OBV indicator. Then, look at whether the trend matches with the OBV line.
How to calculate it?
A calculation using the following on balance volume formula:
Current OBV = Previous OBV + Current Volume (This applies when the closing price is above the previous closing price.
Current OBV = Previous OBV – Current Volume
Current OBV = Previous OBV (if the closing price is equal to previous close price)
At the same time, a rising OBV is an indication of positive volume pressure that can lead to higher prices.
How to use the On Balance Volume
Using the on-balance volume is a relatively easy process because it is usually built-in in most trading platforms like the TradingView and MetaTrader. Therefore, you don’t need to install it in the marketplace.
Second, you need to look at the chart you are analyzing because the indicator is not suitable for all chart types. It is recommended that you use it when the price of an asset is trending upwards or downwards.
As you will realize, the indicator does not work well when the price of an asset is ranging.
Finally, you need to check the indicator’s timeframe. When using TradingView, the default selection is the same as the chart. It is recommended that you make this selection since it won’t make sense to analyze a weekly chart with a daily OBV.
Related » How Many Timeframes Should You Use?
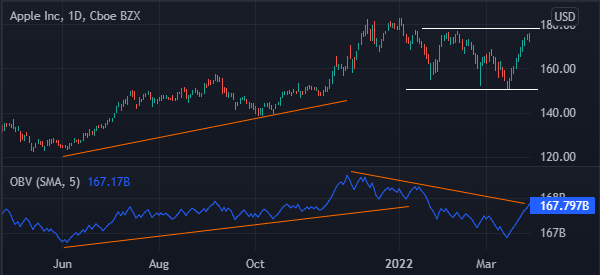
A good example of the OBV indicator at work is shown in the chart below, As you can see, the overall trend of the Apple stock price is upwards as long as the OBV indicator is rising. The uptrend starts fading as the OBV indicator starts moving sideways.
On Balance Volume strategy
As with all other indicators, you don’t need to know how to calculate the OBV indicator. All you need to do is to apply it on your charts and then interpret it.
Also, you need to know that OBV works well on trending markets. Indeed, it should not be used when markets are consolidating.
You need to know that OBV works well when it is used in combination with other indicators. These indicators could be the likes of moving averages and relative strength index.
» Technical Analysis: Briefing
Follow and confirm trends
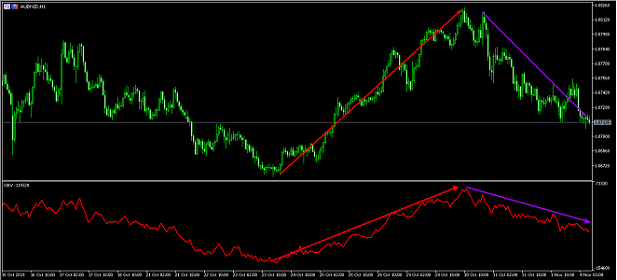
One way of using the on balance volume is to follow and confirm a trend, as shown on the chart below. As seen, the price of EUR/USD pair rose when the OBV indicator was on an upward trend. The price started to decline when the OBV was declining.
Therefore, it is easy to use the indicator when the price is rising. Another way of using the indicator is to find when a currency pair or stock wants to diverge and move lower.
Combine with other indicators
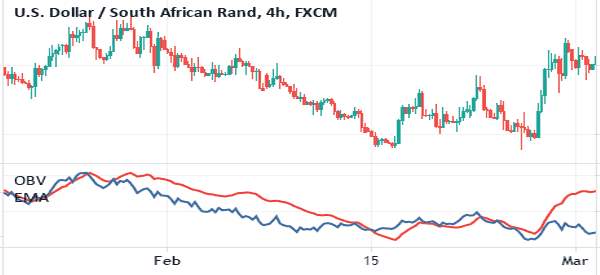
Another strategy of using the on-balance volume is to combine it with another indicator. The most popular way, as stated above, is to combine it with a moving average and find the crossovers.
For example, in the chart below, buying and selling signals emerged when the on-balance volume made a crossover with the moving average.
Find divergences
Another strategy for using the On Balance Volume is to use divergencies. A divergence happens when the OBV indicator is rising when the price of an asset is falling. When that happens, it usually means there is an imbalance between an asset’s price and the overall volume.
In other words, a bullish divergence forms when the OBV is rising while the stock is falling. However, in most cases, these divergences are usually hard to see.
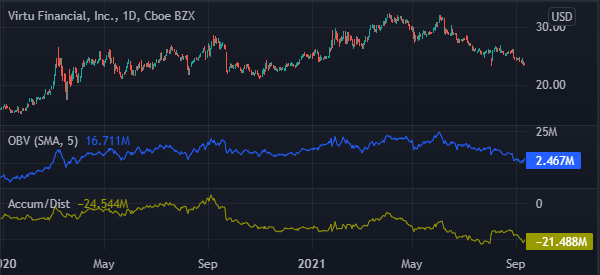
OBV vs accumulation/distribution
OBV and AD have a close resemblance as you can see in the chart below. However, the two have a major difference because accumulation and distribution measures the cumulative flow of money into and out of a security.
It is calculated by first establishing the money flow multiplier and the using it to find a money flow volume. Finally, you combine this with the ADL line.
Limitations
There are several limitations for using the OBV indicator when trading:
- It is not suitable for day traders.
- It is a bit hard to identify divergences using the indicator.
- It cannot be used alone effetively.
Summary
The On-Balance-Volume (OBV) is an important technical indicator in the market, although not suitable for day traders. It appears as a single line that tends not to tell a lot about a financial asset. However, when used well, it can help you identify where to buy or sell an asset.
External Useful Resources
- On-Balance Volume (OBV) Definition – Investopedia
- Technical indicatos and Overlays: OBV – Stockcharts
