The price-to-earnings (PE) ratio is an important financial metric used to identify the amount that investors or shareholders are willing to pay for a company. It simply compares the current share price and a company’s earnings.
In this article, we’ll look at what the PE ratio is, how it is calculated, its types, and how to use it in the market.
What is the PE ratio?
The PE ratio is a financial calculation that weighs a company’s earnings and the share price. Earnings refers to a company’s earnings per share, also known as EPS while the price is the current share price of the company.
The PE ratio is an important number that is mostly used by long-term investors who want to see whether a company is overvalued and undervalued. A company with a PE ratio of 10 is said to be undervalued compared to one whose PE ratio is at 40.
However, as we will explain below, this does not always mean that a firm with a lower PE is better than the one with a higher multiple. In fact, most times, firms with higher multiples perform better than the others.
Related » How to trade During the Earnings Season?
How Price-to-Earnings is calculated
The calculation of PE ratio is relatively easy. You use the following formula:
| PE Ratio = Market value per share / Earnings per share |
The market value per share refers to the current share price. For example, in February 2021, Apple’s share price was trading at $136, making it the market value per share.
The earnings per share (EPS) is usually provided in a company’s income statement. It is simply calculated by taking a company’s net earnings and dividing it by the outstanding shares.
For example, if a company made a net profit of about $1,000,000 and it has 10,000 shares, it means that the earnings per share is 100.
There are several types of EPS in the market, including:
- diluted EPS
- ongoing EPS
- forward EPS
- headline EPS
Also, the PE can be based on Generally Accepted Accounting Principles (GAAP) and non-GAAP basis.
As a trader, you can find the PE ratio of a company by just calculating. However, you can find it in most of the free charting and financial media platforms like Investing.com and SeekingAlpha.
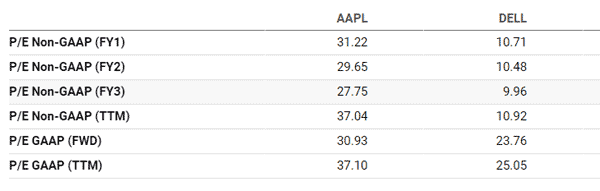
For example, the image below shows the PEs of companies like Apple and Dell.
When a company does not have a PE ratio
At times, some companies do not have a PE multiple. PE is calculated by looking at a company’s stock price and its earnings; therefore, a company that does not have earnings cannot have a PE ratio.
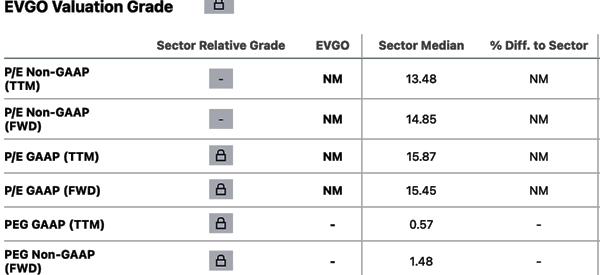
For example, as shown below, EVGO, which is a loss-making electric vehicle company, has no PE ratio.
Types of PE ratio
As seen above, there are several types of PE ratio that are important for investors and traders.
First, there is a trailing PE ratio. This simply means the ratio of the current price and the past earnings. For example, you can use a company’s trailing twelve-month earnings to calculate the ratio.
Second, there is the forward PE ratio. This is where you use the current price of a stock and the average analysts’ forecasts. You can get the average earnings forecasts from companies like SeekingAlpha, Finviz, Investing, and Yahoo Finance.
While the trailing PE is useful, many investors prefer using the forward ratio because of their forward-looking characteristics. In other words, investors are more concerned about the future than the past.
Third, there is the GAAP and non-GAAP PE ratio. The two use the current share price and the GAAP and non-GAAP earnings. As shown above, the two ratios are usually different for the same company.
Fourth, there is the PEG ratio, which simply means the price-to-earnings to-growth ratio. Basically, this is a type of PE ratio that also factors-in a company’s growth. It is calculated by dividing the share price and EPS and then dividing the result by EPS growth.
PE ratio vs earnings yield
A common question is on the difference between a company’s PE ratio and the earnings yield. As mentioned, PE is a ratio that looks at a company’s valuation by comparing its stock price with its earnings per share. It is calculated by dividing the stock’s price and EPS. A higher PE means that a company is overvalued.
The earnings yield, on the other hand, is a company’s EPS divided by the stock price. This means that it is the opposite of the PE multiple.
For example, if a stock is trading at $20 and the company has an EPS of 25 cents, it means that its earnings yield was 1.25%.
A low earnings yield is usually a sign that a company is overvalued while a higher one is a sign that a company is undervalued. However, as with the PE multiple, the figure should be compared with those of other companies.
PE vs PEG ratio
The PE ratio is a good and popular metric for establishing a company’s valuation. However, the multiple has some issues such as that it does not incorporate a company’s growth.
This is where the price to earnings to growth (PEG) ratio comes in. This is a ratio calculated by first establishing a firm’s PE multiple and then dividing it with the earnings growth rate.
For example, assume that two similar companies have PE multiples of 10 and 15. In this case, the former company might seem appealing since it has a lower multiple.
However, when you incorporate the expected growth rate, say of 5 and 9, you might find that the latter is a better alternative.
Common Alternatives to PE ratio
There are several other popular alternatives to the PE ratio of a company. The most popular is known as the price to sales (PS) ratio. It simply measures the company’s revenue in a certain period to the share price.
While this is a good ratio, it tends to say little about a company because investors are more concerned about a firm’s profitability.
Second, there is the enterprise value (EV) to Earnings Before Interest, Tax, Depreciation, and Amortization (EBITDA) ratio. This is a useful ratio that compares a firm’s enterprise value and its EBITDA.
The EV shows the real value of a company by considering the market cap, equity, and debt.
Third, there is the price to cash flow ratio that measures the current price and compares it with the current free cash flow (FCF).
How to use the PE ratio in trading
In most cases, the PE ratio of a company is not used by day traders. That’s because traders are only focused on a company’s share price movement and not the intrinsic value. In their part, investors use the PE ratio in several ways.
For example, they compare a company’s PE ratio with the overall PE ratio. For example, you can compare a company’s ratio with that of its peer companies or the overall S&P 500 index.
A good source of the S&P 500 PE ratio is Multipl. If the S&P 500 PE ratio is 30 and a company has a ratio of 10, it means that the company is undervalued. Investors also compare a firm’s PE ratio with that of its peer firms.
A common mistake many investors make is to always invest in low multiple companies. In the past, many high PE stocks like Shopify and Crowdstrike tended to outperform those with lower PEs.
That’s because the demand for high-flying tech companies is usually higher than that of companies in traditional sectors like oil and gas.
How to compare companies using the PE ratio
At face value, a company’s price to earnings ratio gives you little information. For example, if Microsoft’s forward PE multiple is 33, it does not give you the real picture of the situation.
There are two main ways of using the PE ratio well. First, you should look at the multiple with its historic information. In Microsoft’s case, if the company’s five-year average is 50, it means that the company is getting cheaper.
The other approach is to compare it with companies that operate in its industry. If Microsoft has a PE ratio of 33 and Adobe has a multiple of 45, it means that the latter is trading at a premium. As such, you should dig deeper to establish the reason for this.
There are many websites that you can use to compare companies in terms of PE ratios. Seeking Alpha’s comparison tool is one of the best ones to do this. In the chart below, we have compared Microsoft’s PE multiple with other SAAS companies like Salesforce, Adobe, Oracle, ServiceNow, and CrowdStrike.
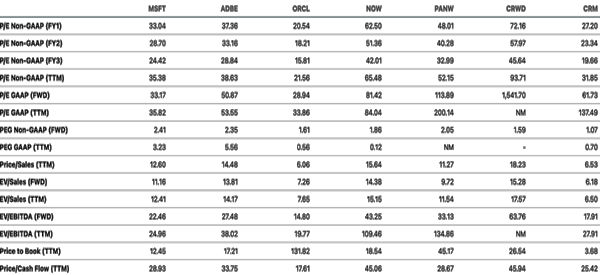
An important rule is to ensure that companies that you are looking at are in the same industry and phase of growth.
For example, while General Motors, Ford, Stellantis, and Tesla are in the same industry, the latter has faster growth and will always have a higher multiple.
Similarly, comparing companies like Visa, 3M, and ExxonMobil will not make sense since they are all in different industries. In this case, Visa will always have a higher multiple since it has higher growth and margins.
Final thoughts
The PE ratio is a term you will always encounter in your trading and investing journey. In this article, we have looked at what it is, how to calculate it, the several types of PE, and other terms related to the PE.
External Useful Resources
- Stock Analysis Using the P/E Ratio – Schwab
