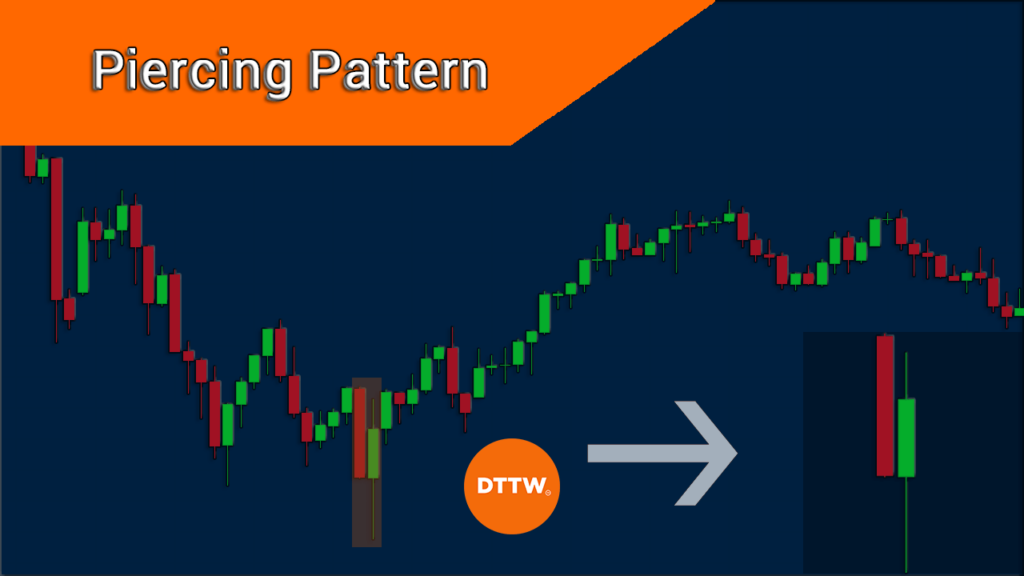
A piercing candlestick pattern is a bullish reversal pattern that happens during a time when the asset is in a downward trend. It has a close resemblance to a bullish engulfing pattern, which is also a two-candle pattern.
In this article, we will explain what a piercing candlestick is and whether it is a good pattern to use in day trading.
What is a piercing line candlestick?
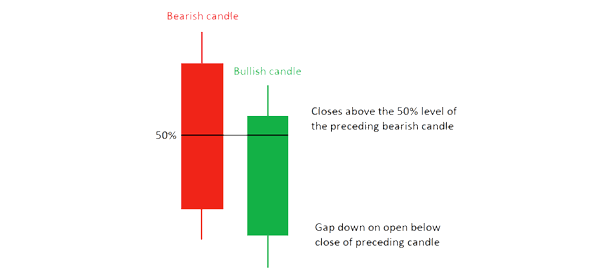
A piercing candlestick pattern happens when a falling asset makes a long bearish candle that is then followed by a smaller bullish candle that closes above 50% of the preceding bearish candlestick.
While 50% is the most common level, it is hard to estimate it. Therefore, most traders use a visual approach to determine whether to buy or sell the asset. The chart below shows how this pattern forms.
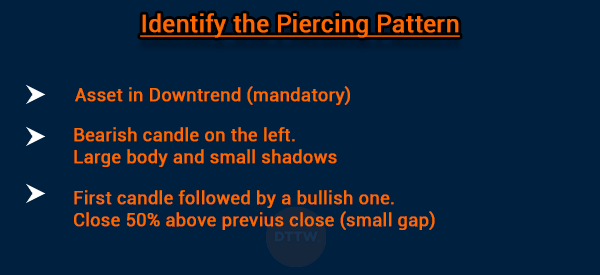
How to identify a piercing pattern
Identifying the piercing line pattern is a relatively easy exercise to do. First, you need to ensure that the asset’s price is in a downtrend. If it is not, then the pattern you note is not a piercing line.
Second, on the left, there is a bearish candle that often has a large body and small upper and lower shadows. The length of this candlestick is an important one to note since it needs to be a bit long.
Third, the bearish candle is followed by a bullish candle that closes about 50% above the previous candlestick’s close. This candle should have a small gap.
As shown above, this bullish candle usually opens lower than the other candlestick.
What does the piercing line pattern tell a trader?
A piercing line indicator tells a trader a number of things. First, it tells them that the bearish trend is losing steam since the price closed above the bearish candle.
Second, the pattern tells them that a new bullish trend is about to start. However, it also tells traders that there could be a bearish continuation when there is a false breakout pattern.
Example of a piercing line candlestick
The chart below shows a good example of a piercing line pattern. In this chart, we see that the price of crude oil has been in a strong bearish trend. We also see that the commodity formed a strong bearish candlestick.
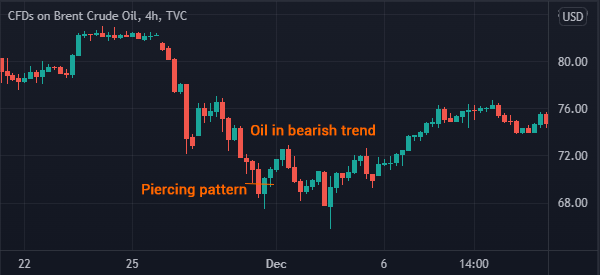
It then formed a strong gap pattern and then it closed about 50% above the price. As you can see, the price made a short comeback during this time.
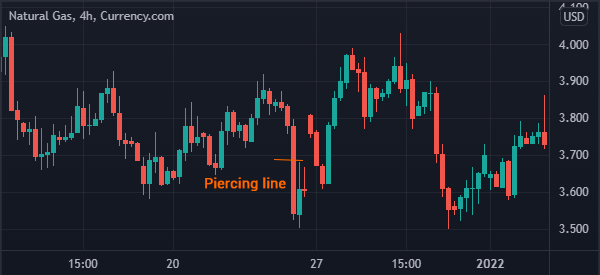
Another example is that the price of natural gas was in a strong bearish trend. It made a strong bearish candlestick, which was followed by a bullish candle. The price then formed a small bullish trend.
Strategies to trade piercing line candlestick
There are several strategies that one can use to trade the piercing line candlestick pattern. One way is to initiate a bullish trade slightly above the bullish candlestick.
It is recommended that you use a buy-stop trade. If the bullish breakout happens, there is a possibility that the buy-stop trade will be initiated.
The other approach is to set a sell-stop trade at the lower side of the piercing pattern. If the piercing pattern fails, the sell-stop trade will be initiated and the downward trend will continue.
The benefit of using these pending orders is that the trades will be initiated when the conditions happen.
Further, you can combine the trading pattern with technical indicators like the Relative Strength Index (RSI) and the Stochastic Oscillator. If the pattern forms as these indicators are in an oversold level, it could be a sign that a new bullish trade is about to form.
Pros and cons
There are several benefits of using the piercing line. Let us start with the benefits first:
- It is an easy-to-use chart pattern.
- It can be identified without doing a lot of searching.
- It is easy to find entry and exit points when using the indicator.
On the other hand, some of the disadvantages of using the piercing line are:
- It is a relatively rare pattern that forms just occasionally.
- It is not as effective pattern like doji and morning star.
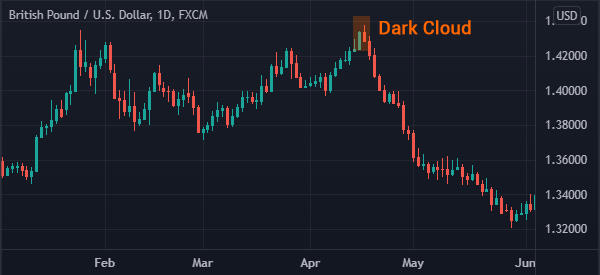
Piercing line vs dark cloud cover
The piercing line and dark cloud cover are similar patterns. The only difference is that the dark cloud cover happens during a bullish trend.
It happens when an asset forms a long bullish candle that is followed by a bearish candle that closes about 50% below its close. A good example of this pattern is shown in the chart below.
Summary
The piercing line is a popular trading pattern. In this article, we have looked at how it works, its key characteristics, and how it differs from the dark cloud cover pattern.
External useful resources
- Some more charts examples about piercing pattern – Candlescanner
