The concept of support and resistance is the most important one in technical analysis. The support level is often viewed as a floor, where the price struggles to pass while the resistance is a ceiling where the price struggles to move higher. Support and resistance levels are usually signs of indecision between bears and bulls.
There are many ways of drawing the support and resistance levels. In this article, we will look at a guide on how to draw Pivot Points in Trading and use them in the market.
What is a Pivot Point?
A pivot point is a level where the sentiment of the market changes from being bullish to bearish. The vice versa is also true. If the price moves past the first support or resistance, the market tends to expect that it will move to the second level.
Therefore, pivot points are important tools that many pros use to identify where the price will move to next. They are also used to locate take-profit and stop-loss.
Types of pivot points
There are four main ways of drawing the pivot points. These are:
- the standard pivot points
- Woodie pivot points
- Camarilla pivot points
- Fibonacci pivot points.
While we recommend using the standard method.
As you begin, there is always an eternal debate among market participants on the close, open, high, and low prices because the forex market is usually open 24 hours every day.
Another thing.
While we recommend that you calculate these pivot points yourself, you can use the free pivot points provided by a number of online platforms. As you do this, we recommend that you establish how they calculated these points.
Standard Pivot Points
The standard pivot point is calculated in a simple way. First, you calculate the pivot point (PP). You do this by adding the high, low, and close, and then divide the result by three.
The first resistance (R1) is calculated by multiplying 2 with the PP and then you subtract the low (2xPP) – low. The first support (S1) is calculated by (2XPP) – high.
The S2 and R2 are calculated by:
R2 = PP + (high-low)
S2 = PP – (High – Low)
The R3 and S3 are calculated by:
R3 = High + 2(PP-low)
S3 = Low – 2(High – PP)
Woodie Pivot Points
The Woodie pivot points are calculated differently from the standard or classical pivot points. They are calculated using the formula below.
First, you calculate the pivot point (PP) using the following formula: (H+L+2C)/4
R1 = (2xPP) – Low
R2 = PP + High – Low
S1 = (2 x PP) – High
S2 = PP – High + Low
Here are a few things about the Woodie Pivot Points.
First, as mentioned, the PP are calculated using a different formula than the classic points. Second, there are traders who prefer these points because they put more weight to the previous period’s closing price.
Fibonacci Pivot Points
The concept of Fibonacci Retracement is very essential in the market. It is essential because it has been used successfully for more than a century.
And it is also used to calculate pivot points!
The following formula is used:
First, you calculate the pivot point using the following formula: (H + L + C) / 3
The R1 is calculated by PP + ((High – Low) x 0.382). The R2 is calculated by PP + (High – Low) x0.618 and the R3 is calculated by PP + ((High – Low) x 1.000.
The S1 is calculated by PP – ((High – Low) x 0.382. The R2 is calculated by PP – ((High – Low) x 0.618 while the S3 is calculated by PP – ((High – Low) x 1.000.
As you have seen, we have not calculated the Camarilla pivot points. This is simply because it is not a very popular type of pivot points.
Camarilla pivot points
Camarilla pivot point is also a relatively popular type of point in the market. The difference is that it introduces the concept of Fibonacci lines in the calculation. The tool’s calculation is a relatively long one. The first step is to add the high, low, and closing price and then divide the 3.
To get the first resistance, you use the following formula:
| R1 = Closing + ((High -Low x 1.0833) |
For S1, you do the opposite:
| closing – ((high – low) x 1.0833) |
You should then repeat these for the rest of the support and resistance levels.
Pivot Points trading strategies
Now that you know about pivot points, it is important that you know how to use them in the markets!
- First, you should always use pivot points when the market is trending. This means that you should never use them when the market is ranging or when it is consolidating.
- Second, ensure that you place your targets conservatively. By this, you should place them slightly below the resistance levels and slightly above the support levels.
- Finally, you should use the pivot point type that suits your trading style.
Let’s see how to apply it in practice.
You just need to go find a chart you want to analyze and select the type of pivot point that you want to use and the number of back pivots. In most cases, three will be enough.
After this, select the number of levels of the points you want to use. If the price is at the pivot point level, there is no need for having support and resistance 3 and above. Finally, you can change the colours of these pivot points for easier identification.
For example, in the EUR/USD pair, we have added a standard pivot point with three back pivots. We have also added the first and second support and resistance levels.
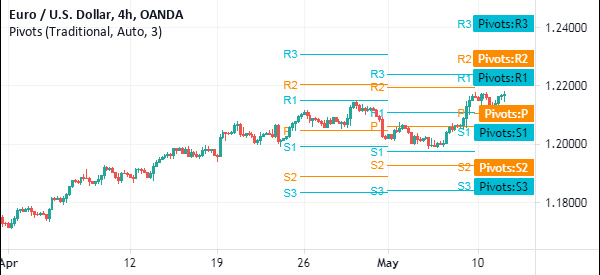
Therefore, in this chart, we see that the pair dropped and hovered close to the first level of resistance and then rose back. At the time of writing, the price is at the pivot point level. Therefore, if the price rises above this level, the next level to watch is the first resistance, and so on.
Final thoughts
Pivot points are important tools that can help you identify areas of potential support and resistance levels. They are used by most professional day traders. In this article, we have looked at what they are, how to use them, and some of the strategies to use them.
External Useful Resources
- Using Pivot Points for Predictions – Investopedia
