Price action is a simple trading strategy that involves looking at charts, identifying the patterns, and predicting the direction of an asset. It differs with technical analysis because you don’t need to use technical indicators like moving averages and Bollinger Bands.
It also differs from fundamental analysis because you don’t need to know the underlying news and technical data for the day.
How price action works
Traders have used the price action trading strategy for centuries. The fundamental premise of the strategy is that price movements in the financial markets are usually based on psychology or the so-called herd mentality.
Therefore, if the price of an asset is moving in an upward trend, a price action trader can just buy the asset using the trend following trading strategy. Another example is when a trader initiates a short trade because they have identified a shooting star candlestick pattern.
Price action steps
There are two steps to trade price action. First, we recommend that you do a multi-timeframe analysis. This is where you start your analysis by looking at a longer duration chart and then narrow it to a smaller one.
As you do this, you should be looking at potential chart and candlestick patterns. At times, you will see patterns like triangles and head and shoulders form in longer chart.
Second, study these charts and then enter your trades. In this case, you should enter the trade in your preferred chart timeframe. For example, if you are a scalper, ensure that you start the trade on a chart that is less than 5 minutes (we have strategies for 1 minute charts too).
Types of Price Actions
There are three types of price actions: upward, downward, and sideways.
In an upward trend, your strategy is to buy low and exit the trade when the price rises. In a downward trend, the strategy is to sell when the security’s price is high and exit when it is low.
The sideways trend is also known as a consolidation phase. In it, the strategy is to wait until a new trend form. This is because it is almost impossible to make money in a narrow horizontal trend.
Price action trading strategies
There are several price action strategies that traders use in the market. For this report, we will briefly look at some of these strategies.
Trend following (and trendlines)
As the name suggests, trend following is the process of identifying an existing trend and following it. If the trend is bullish, a trader could buy the asset and benefit when the price rises. Similarly, if the trend is bearish, the trader shorts the asset and benefits when it falls.
Ideally, trend following is based on the Newton’s law of motion, which states that an object in motion will retain its direction until it finds an equal force in the opposite direction.
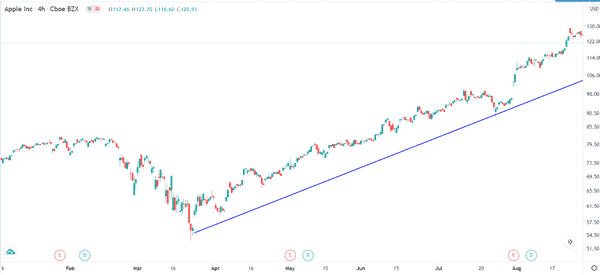
A good example of this strategy is in the Apple shares shown below. As you can see, the company’s shares have been in a strong upward trend. Therefore, a trend following can enter a bullish trend and benefit when the price rises.
In this chart, a trader would have implemented a bullish trade as long as it was above the rising trendline.
Channels
Channels are other popular price action trading strategy. A channel is simply a situation where the price of an asset makes parallel support and resistance levels. Ideally, when you identify a channel, the goal is to buy at the lower side and short at the upper side.
Related » How to Day Trading with Support and Resistance Levels
For starters, a channel is usually drawn by connecting a series of lower and upper swings. A good example of this strategy is shown in the EUR/USD pair shown below.
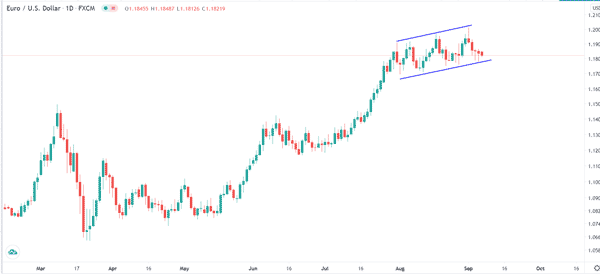
Basically, in the chart above, a trader can buy the EUR/USD pair when the price tests the support and then short when it tests the upper side. However, a key risk when using this strategy is when the price finally breaks out in either direction.
To stay safe, you should always have a stop loss at a reasonable level to protect your account from losses.
Elliot wave strategy
Another popular price action trading strategy is the Elliot wave. The strategy was developed by Ralph Elliot, who spent years analysing financial charts. He realised that assets tend to move in patterns that he called waves.
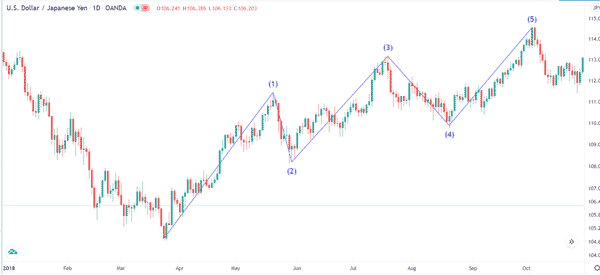
He identified that in a bull market, the price of an asset moves in five waves, that he named impulse waves. After reaching the top, the asset then forms a corrective wave. A good example of this is shown in the USD/JPY pair shown below.
It is worth noting that Elliot wave is a relatively complicated trading strategy that has several rules and several months to master. You can use our complete guide on Elliot Wave analysis to learn more about it.
Reversals
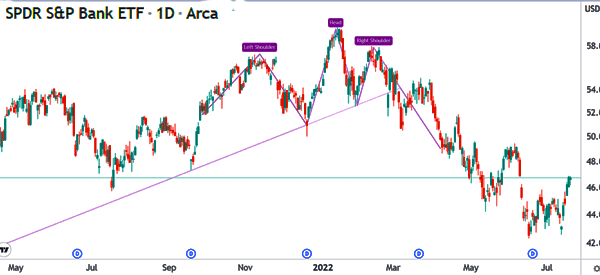
Another price action strategy is known as reversals. It involves waiting for an asset to change its direction. Some of the top reversal chart patterns that you can use are double and triple top, head and shoulders, and wedge patterns.
A good example of this is shown in the chart above. The chart shows a head and shoulders pattern on the KBE stock.
Breakouts
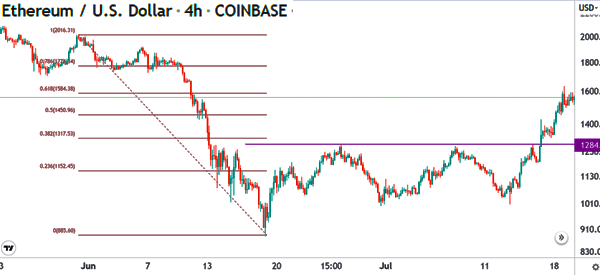
Another popular price action strategy is known as breakouts. This strategy works when there is an existing pattern or consolidation. A good example of this is shown in the chart below.
As you can see, Ethereum struggled moving above the important resistance at $1,264. But when it rose, it managed to form a strong bullish breakout.
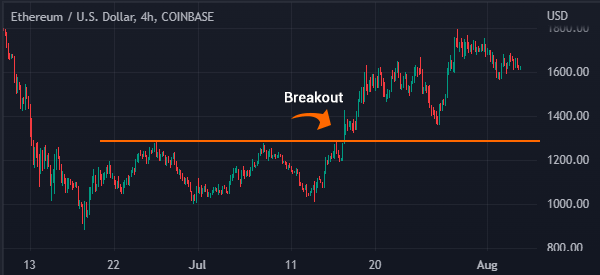
A good way of trading such a pattern is to place a buy stop above the resistance point. In this case, if the breakout happens, the buy stop trade will be executed.
Candlestick patterns
Candlestick patterns are another popular way to use the price action strategy. These are special patterns that have been used for decades to predict the direction of an asset.
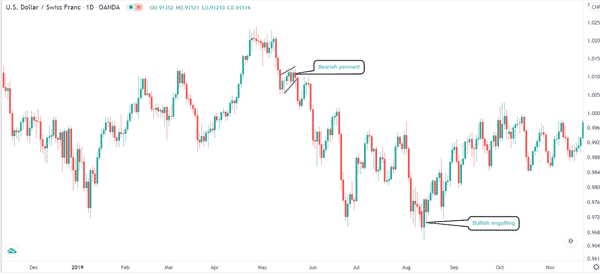
Some of the popular candlestick patterns in use today are the hammer, Doji, shooting star, hanging man, pennants, bullish and bearish engulfing patterns, and morning star patterns. In most cases, these patterns are used to identify reversals and continuations.
You can see a good example of the bearish pennant and bullish engulfing pattern below.
Best price action indicators
As mentioned above, price action strategy does not necessarily require the use of technical indicators. However, wise traders combine the strategy with technical and fundamental analysis. Ideally, the goal of using these indicators is to confirm whether a new trend has formed.
Among the most popular technical indicators that traders using the price action strategy use are moving averages, Bollinger bands, and the Relative Strength Index.
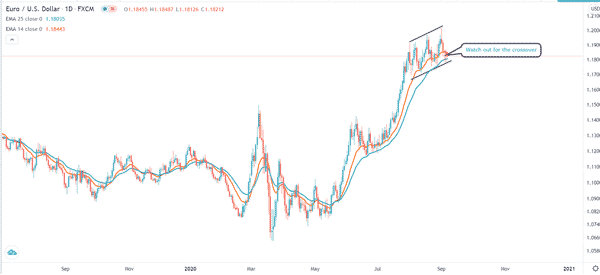
For example, in the EUR/USD chart shown above, we can use a double exponential moving average to confirm the direction that the break out will happen. If the 25-day and 14-day EMAs crossover, it means that the price is likely to breakout lower.
Fibonacci Retracement
The Fibonacci Retracement tool is an essential one in price action analysis. The tool is used to identify potential targets of an asset.
It is added by connecting the highest and lower swings in a chart and then noting the specific retracement levels. As shown below, Ethereum finds some resistance when it hits several retracement points.
Final thoughts
Price action is a trading strategy that has been around for decades. It is also one of the most accurate strategies. For example, if you decide to follow – instead of going against – a trend, you will have a likelihood of making money.
At the same time, price action is a wide area that requires a lot of learning and experimenting. We recommend that you spend a lot of time learning patterns before you use your real money.
External Useful Resources
- Learning price action trading for beginners: a step-by-step guide – Trading Setups Review
