
Momentum stocks refer to those equities that keep rising despite their hefty valuations and elevated levels of their share prices. It can also apply in other asset classes like cryptocurrencies, commodities, and even currencies.
In this article, we will look at some of the top strategies for finding the best momentum stocks and how to day trade them.
The case of Nvidia
Let us first look at the case of Nvidia, one of the best momentum stocks of our time. For starters, Nvidia is a technology company that is best known for its Graphical Processing Unit (GPU). The company competes with other tech titans like AMD and Intel.
In the past few years, Nvidia has been on a strong growth path considering that its GPUs are used in gaming, cryptocurrency mining, electric cars, and other internet of things (IoT) processes. As a result, its stock has surged, pushing its total market capitalization to more than $1 trillion.
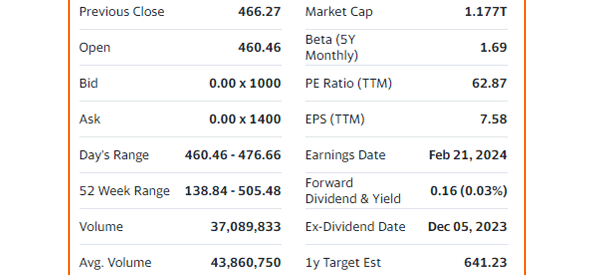
At the same time, its valuation metrics have been elevated, which has pushed many investors at bay. For example, it has a trailing PE ratio of 62.9 and a forward PE of 26.5. These are pricey numbers, as shown below.
Yet, the stock has kept defying gravity, as shown below.
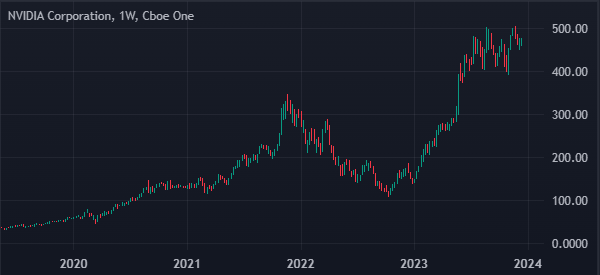
Therefore, investors who shorted the stock because of its valuation metrics have gone through a short squeeze. Nvidia is not alone. Over the years, the performance of momentum stocks has been better than that of value and even dividend stocks.
How to find momentum stocks
With this in mind, how then can you find quality momentum stocks to trade or invest in? There are two main ways to approach this.
Growth sectors
The first way to find momentum stocks is to look at sectors that are growing. Presently, some of those sectors that have achieved robust growth are in e-commerce, cloud computing, electric vehicles, clean energy, and space sectors.
With this in mind, you could use screeners to find some of the companies that are doing well in these sectors.
52-week highs
Another simple way of finding momentum stocks is to simply find companies that are hitting their 52-week highs. In most cases, these companies will exhibit some of the momentum characteristics.
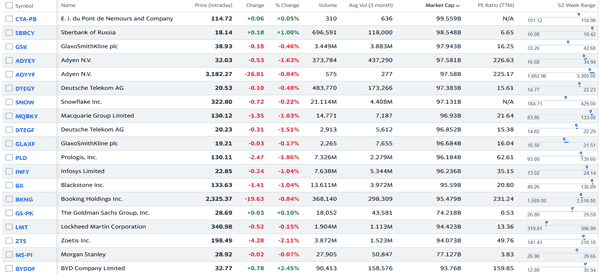
There are many free websites that show companies hitting their 52-week highs and lows. Some of the most popular ones are Barchart.com, Investing.com, and Yahoo Finance. The chart below shows companies that recently hit these highs.
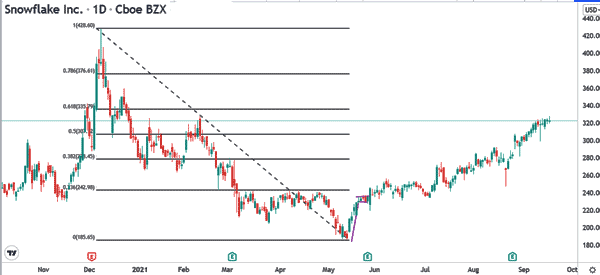
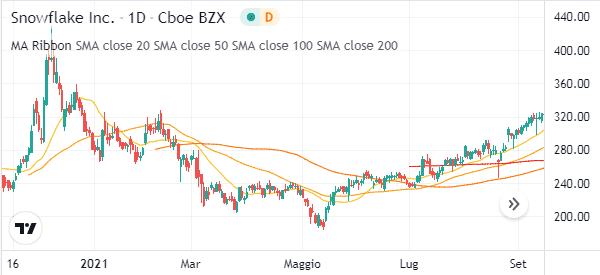
The chart below shows the performance of SnowFlake, which is one of the companies in that list. As you can see, the shares have been in a strong bullish momentum.
In addition to the 52-week high, you could decide to look at shares that are hitting their all-time high. The benefit of investing in these shares is that their success tends to attract more bidders for the stocks.
Sector momentum
At times, stocks in a specific sector can show momentum. For example, in 2023, companies in the artificial intelligence (AI) industry soared as investors cheered the success of ChatGPT, Bard AI, and Anthropic.
Similarly, a few years ago, companies in the solar and wind industry did well as investors cheered investments in ESG companies. Companies in the electric vehicle industry also gained momentum as investors cheered rising demand by both retail and institutional investors.
Using technical indicators to find momentum stocks
The other approach for finding momentum stocks is to use technical indicators. There are many indicators that can help you in this. Some of the top momentum indicators are:
Relative Strength Index (RSI)
The RSI is an indicator that looks at the speed of change of an asset. A stock is said to have some short-term momentum when the RSI is in an uptrend such as when it hits the overbought point.
RVOL
The Relative Volume indicator compares the volume data for each price bar with the average volume of a specified number of prior bars. It is calculated by dividing the current volume and the average volume over the look-back period. In most cases, the average volume is based on the 50-period SMA.
The RVOL’s interpretation is relatively simple. If the RVOL value stands at 2, it means that the volume of the current bar is 2 times the normal volume for the specific bar. A higher figure means that the momentum will continue.
MACD
The Moving Average Convergence Divergence (MACD) is another technical indicator that can help you identify momentum stocks. The indicator works by transforming moving averages into an oscillator. Like the RSI, it can help you find a momentum stock if the two lines and the histogram are in an uptrend.
There are other popular momentum stocks that you can use in day trading. Some of the most popular of these indicators are Average Directional Index (ADX), Commodity Channel Index (CCI), and Momentum.
How to trade momentum stocks
With this in mind, how do you trade momentum stocks? There are several strategies to use when trading these stocks.
Buy high, sell higher
This idea goes against the rules of investing that says you should buy low and sell high. Instead, it proposes that you should buy high and aim to exit when the price moves higher.
You should only do this when you have done enough research about the situation. Also, you should use other trading strategies to know whether the stock is a good buy at a higher price.
One approach is to use the Fibonacci retracement levels. In the Snowflake example above, we see that the stock moved above the 50% Fibonacci retracement level. Therefore, there is a high probability that the momentum will continue, pushing the stock to the 78.6% retracement level at $376.
You could also use the concept of Elliot Wave. Here, your goal is to combine Fibonacci retracements and knowing the stage of the Elliot wave pattern where the stock is.
You can apply the concept of buying high and selling higher in the opposite direction. This simply means that you could short stocks that are at key low moments and exit as the price keeps falling.
Buying the dips
In most cases, momentum stocks don’t soar in a straight line. There are moments where the stocks pull back. In this case, you could use the buy the dip strategy, where you buy the stock when it retreats. It is a relatively popular strategy that works. But, like all other strategies, it must be used well and with care since some dips tend to last longer.
Technical indicators
Another way to trade momentum stocks is to use technical indicators. These are tools created using mathematical calculations.
Some of the best indicators to use when trading momentum stocks are moving averages, Bollinger Bands, VWAP, and Ichimoku cloud (but there are hundreds of tools).
For example, in the Snowflake example shown above, we have added the 20-day, 50-day, 100-day, and 200-day moving averages. Therefore, in this case, the bullish trend will remain as long as the price is above these moving averages.
Growth vs momentum stocks
A common question is on whether there is a difference between growth stocks and momentum stocks. While the two are quite similar, there are some differences that you should know about.
Growth stocks refer to companies that show elevated strong annual growth rates. In most cases, these companies tend to have as high as 20% annual rates of growth.
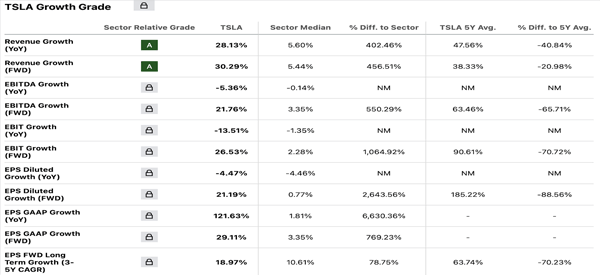
A good example of this is Tesla, which has become the biggest electric vehicle (EV) company in the world. As shown below, the company has a YoY growth rate of 28.13% and 30.30%.
Momentum stocks, on the other hand, are companies that show strong stock price growth. At times, momentum stocks don’t have strong revenue or profitability growth.
For example, a company like ExxonMobil does not have a strong revenue growth but at times, it can become a momentum stock if its stock is in a strong uptrend.
Summary
Momentum stocks are often expensive stocks that tend to defy gravity. Their valuations tend to defy logic but the equities keep rising. In this article, we have looked at how you can identify momentum stocks and some of the strategies to use when trading them.
External Useful Resources
- How do you find momentum stocks, and how frequently do you change them? – Quora
