A stock market sell-off is a situation where stocks drop suddenly over a daily, weekly, or monthly timeframe. In most cases, the term refers to a sudden decline of the main indices like the S&P 500, Dow Jones, and Nasdaq.
A good example of a stock market sell-off is what happened during the dot com bubble in early 2000s, during the Global Financial crisis, and during the peak of the coronavirus pandemic.
In this report, we will look at the causes of a stock market sell-off and the few strategies to trade when it happens.
Causes of a stock market sell-off
There are several factors that lead to a stock market sell-off. Among them are:
Bursting of a bubble
In the dot com bubble, the sell-off happened as investors started to worry about valuations in the stock market. At the time, many tech companies with no earnings were valued at billions of dollars.
» Related: Are We in a Stock Market Bubble?
Major natural event
The 2020’s sell-off happened because of a natural event, the coronavirus pandemic. A few years ago, Japan stocks sold-off because of the earthquake. These are types of events that cannot be predicted, and therefore the most complicated to prevent.
› Top Assets to Trade during Exceptional Events
Monetary policy
At times, a sudden change of monetary policy tends to lead to a sell-off. For example, if the Fed decides hike rates, the market can react by selling-off.
Corporate earnings
A stock market sell-off can happen when companies report weak earnings and weak forward guidance.
Technical hitch
A technical hitch in a major exchange like Nasdaq or the New York Stock Exchange can lead to a sell-off. A good example of this is what happened in 2010’s flash crash.
Difference between a stock market sell-off and a stock sell-off
There is a difference between a stock market sell-off and a stock sell-off. As mentioned above, a market sell-off is usually viewed in form of the indices like the Dow Jones, DAX, and the S&P 500.
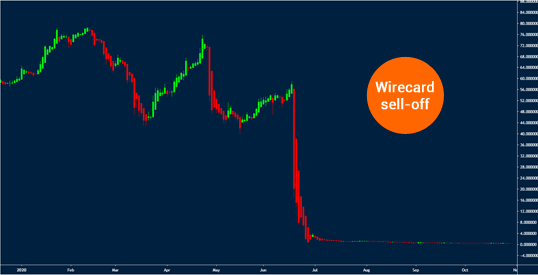
However, a stock sell-off is a situation where traders sell shares of a specific company. A good example is recently, when the market sold shares in Wirecard, the giant German payment processing company.

They did that after EY, the firm’s auditor said that it couldn’t trace $2 billion in its balance sheet.
How to spot a stock market sell-off
It is relatively easy to spot a stock market sell-off. The easiest method is to focus on the major American indices like the Dow Jones, Nasdaq 100, and S&P 500 indices. These indices are usually a representation of the broader American market.
You can use chart systems like those provided by TradingView and other platforms (like our PPro8). If the indices are mostly moving lower, this could be a sign that a stock market sell-off is taking place.
There are two broad types of a market sell-off:
- Correction – A correction is a situation where an index declined by more than 10% from its recent high.
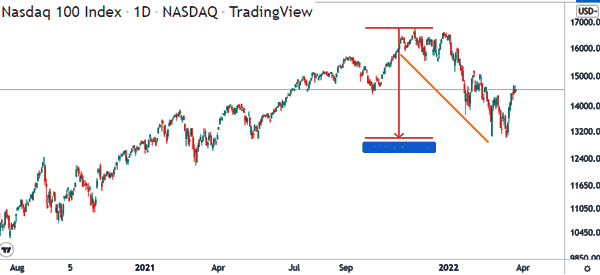
- Bear market – A bear market is when a stock index drops by over 20%. As shown above, the Nasdaq 100 index dropped by 22% between January and March 2022. This means that it moved to a bear market.


What causes a sell-off in the stock market
The causes of a stock market sell-off and that of a stock sell off are similar. But a stock sell-off can happen because of other reasons like:
- Failed M&A deal – A few years, shares in Tiffany dropped sharply after LVMH ended its planned acquisition.
- Accounting issues – An accounting issue, like it happened in Wirecard and Enron can lead to a major sell-off.
- Sector issues – Challenges in a sector can lead to a sell-off. For example, in 2020, oil companies dropped after the price of crude oil dropped.
- New competition – A new entry by a major company can lead to a sell-off. For example, shares of grocery companies dropped after Amazon acquired Whole Foods.
- CEO resignation – Shares of a firm can drop after a beloved CEO resigns or when an influential investor exits his position.
Why traders should not worry about a market sell-off
A market sell-off is usually a bad thing for long-term investors, who see their holdings decimated. Indeed, many long-term investors lost money when stocks fell by more than 20% in 2020.
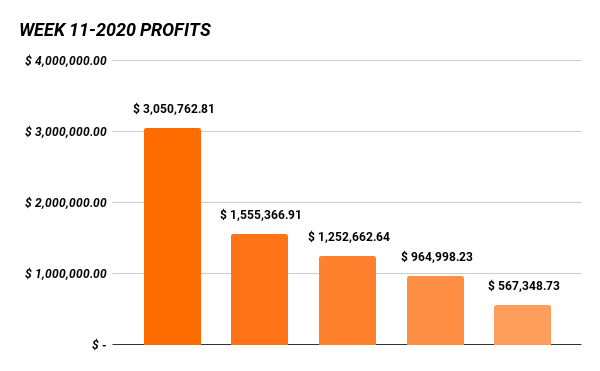
However, traders rejoice during a market sell-off as evidenced by the recent trading profits by big banks like Goldman Sachs and Morgan Stanley. Our traders have had their best years in 2020.


This is because day traders are usually not focused on the long-term. Instead, they are mostly focused about the short-term performance of a market chart. It is also because sell-offs are usually associated with a significant jump in market volatility.
Better still, traders can make money when the price of a financial asset rises by buying and when the price falls by shorting. Shorting is the process of borrowing shares, selling them, keeping the cash, and buying them back when the price falls.
Although it sounds complex, shorting is usually executed electronically just like buying.
Mistakes to do in a stock market sell-off
There are several mistakes that traders and investors can do during a market sell-off.
- Panic selling – This is a situation where investors assume that the sell-off will continue for a while and then they start panic selling. Investors who sold in March 2020 missed one of the biggest bull run on record.
- Move to cash – At times, many people just sell their assets and move to cash, which they see as a safe asset. One strategy is to use the dollar-cost averaging strategy and buy the asset as its price drops.
- Overconfidence – In a market sell-off, many people attempt to buy the dip. This is wrong. Instead, you should use multiple strategies to only buy when there is a strong reversal.
- Forget to rebalance – Rebalancing is an important concept in the market. It refers to a situation where an investor moves from one industry to another. Therefore, some investors tend to forget to rebalance.
- Follow the crowd – At times, many investors and traders make the mistake of following the crowd without doing adequate research.
Final thoughts
A stock market sell-off is a period when the overall stock market drops. While it is usually a difficult period for investors, traders are relatively immune since they can make money when stocks are moving in either direction. They also make more money during sell-off because of more volatility.
Still, it is important to always use the best risk management strategies such as position sizing and having a stop loss on all your trades.
