At Real Trading, our goal is to provide traders from around the world the opportunity to make money trading in the financial market. We believe in equipping new and experienced traders with knowledge and tools to achieve this.
As such, in the past few months, we have been looking at various technical indicators. We have covered indicators like the Relative Strength Index (RSI), Momentum indicator, and the Ichimoku Kinko Hyo.
In this report, we will look at the not-so-popular Rate of Change (RoC) indicator.
Technical Indicators Recap
Before we cover the ROC indicator, let us look briefly at what we have studied so far in this journey. This introduction is important to understand the tool.
First, we saw that there were two main types of indicators. Lagging indicators are those indicators that use past data to predict the future. Examples of lagging indicators are moving averages and the Parabolic SAR.
»Day trading laggard stocks«
Leading indicators on the other hand use historic data and various assumptions to predict future prices. Oscillators like the RSI and the Relative Vigor Index (RVI) are leading indicators.
Second, we have seen that indicators are calculated using complex mathematics. Still, while you can opt to calculate the indicators, we have seen that it is not necessarily necessary.
Third, we have observed the importance of combining various indicators. Some of the advantages are detecting false signals (as breakouts) or reversal of a trend.
What is the Rate of Change (ROC) Indicator?
The Rate of Change is an indicator that is also known as momentum. We have covered the momentum indicator before.
The indicator is found as a default in most platforms like MetaTrader and TradingView. In these platforms, the indicator is usually grouped in the oscillator category.
As we mentioned before, the ROC is a momentum oscillator that measures the percent change in price from one period to another. It is calculated by comparing change of price with the periods.
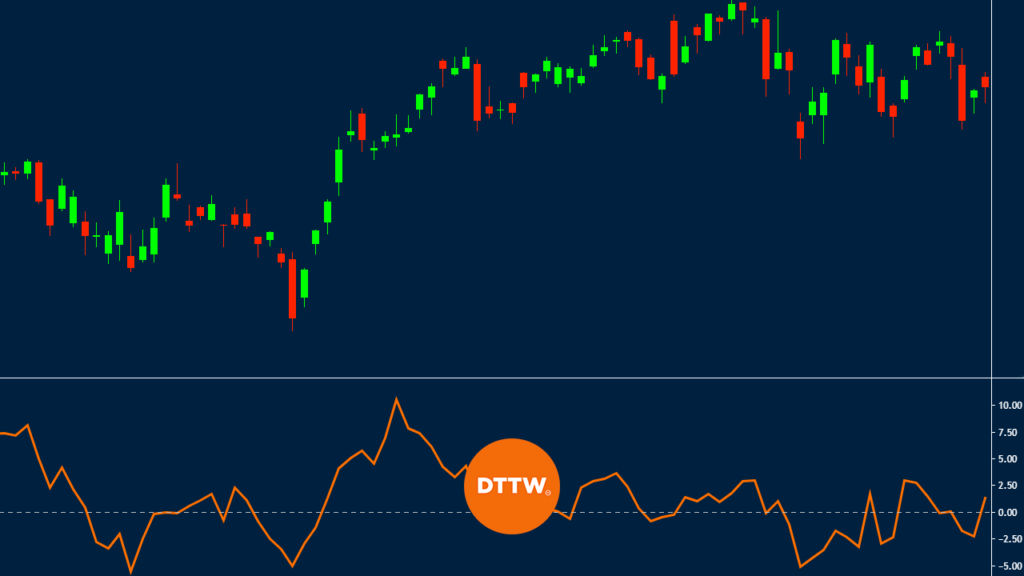
When applied on a chart, the indicator has two lines: The first is the centreline, which is usually zero. The second line is the signal line. This is what traders use to interpret the movement. The signal line is made up of two colors, which are known as Color Up and Color Down.
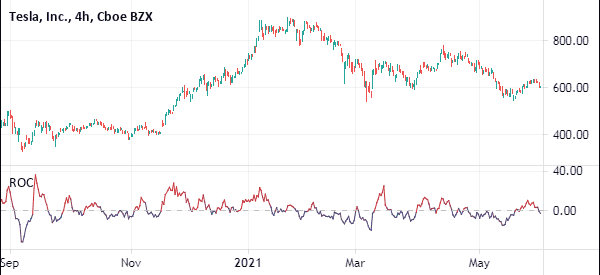
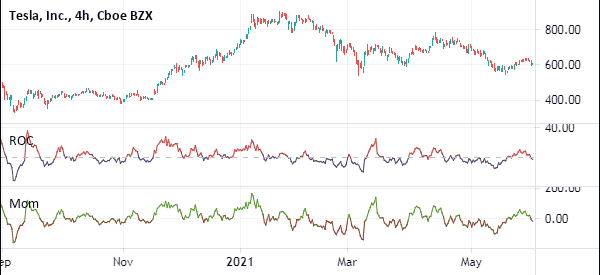
The chart below shows the Rate of Change indicator applied on Tesla’s shares.
How to Calculate the indicator
The ROC indicator is calculated using a very simple method.
| ROC = ((Close – Close n periods ago) / (Close n periods ago)) X 100 |
As with all indicators, you don’t need to calculate this indicator. You can just apply it on a chart and interpret it.
How to Use the Rate of Change Indicator
As mentioned above, the ROC or momentum indicator measures the percentage rise or fall of price over a period of time. In other words, it measures the percentage increase or decrease of price over a period of time.
Therefore, when the price of an asset rises, the ROC indicator is usually positive. Similarly, when the price falls, the momentum indicator is usually negative. Unlike other momentum indicator, there is no ceiling or floor.
To apply the Rate of Change indicator, you just need to enter the length and the preferred colors of the signal line. The default period used in the ROC indicator is 9. You can also change the colour of the centerline.
Confirm a Trend
Traders use the momentum indicator in various ways. The way we prefer to use it is to confirm an already-established trend. This is a strategy that is known as trend following. A good example is shown on the chart below.
The blue lines shows how the price drops as the RC indicator drops too. The red lines show how the price rises as the price of the USD/CAD indicator rises as well.
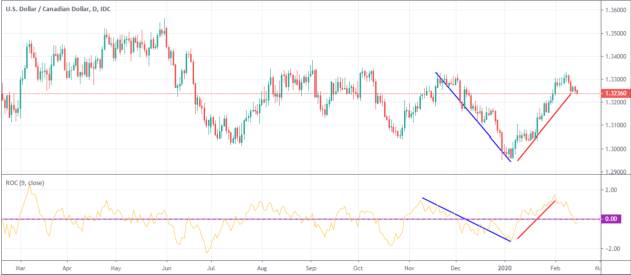
Using this strategy is relatively simple. First, identify a trend that is already formed. If it is a bullish trend, identify how the indicator is moving. The bullish trend will remain so long as the Rate of Change indicator is rising. The trend will be most efficient when it manages to move above the zero line.
On the other hand, if the price is falling, look at the direction of the indicator. If it keeps falling, it means that there are more sellers than buyers. As such, the price will keep falling.
Therefore, you can use the indicator to confirm a trend.
Use it with other indicators
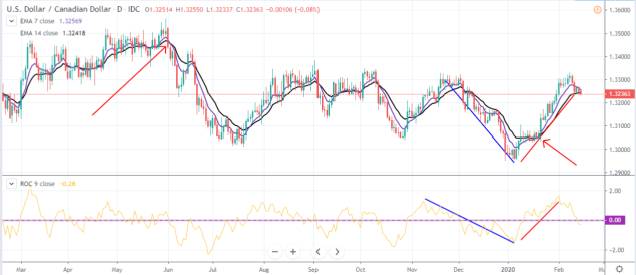
Another way we use the ROC indicator is to confirm what other indicators have shown. Most importantly, we use it to confirm what lagging indicators like moving averages and the Ichimoku Kinko Hyo have shown.
In the example below, we have combined the momentum indicator with the double exponential moving averages.
Rate of Change vs Momentum Indicator
The Rate of Change indicator is relatively similar to Momentum indicator, as you can see in the chart below. The upper one is the ROC while the lower one is the momentum indicator. The only difference between them is that momentum indicator puts more emphasis in percentage terms.
Therefore, most traders use the two indicators in the same way.
Final Thoughts
The Rate of Change (ROC) indicator is an important and common indicator. It is often known as the momentum indicator, and is used mostly to confirm trends. It is ideally used when the market is either trending upwards or downwards. As
a trader, we recommend that you first test the indicator using a demo account before you use it on a live account. This will help you select the best period to use.
External Useful Resources
- Exploring The Amazing Rate Of Change Indicator In MT4 – Dittotrade
- More about ROC charts in Stockcharts
