A rectangle pattern is a relatively popular price action pattern that forms between or after a strong rally. It is also known as a parallel channel and is helpful when identifying reversals or continuations.
In this article, we will look at:
- What the rectangle is
- How to identify it
- How to use it effectively in the financial market
What is a rectangle pattern?
As the name suggests, the rectangle refers to a shape with four sides. In trading, it is easily identified as a pattern with continuous support and a continuous resistance. For starters, a support refers to a floor where the price struggles to move below while a resistance refers to a ceiling where it struggles to move above.
»Day Trading with Support and Resistance Level«
The concept of a rectangle is similar to that of a symmetrical triangle pattern. As we have written before, the symmetrical triangle is usually a signal that the price will soon breakout. But we cannot easily predict the direction of the future breakout.
It is worth noting that the rectangle pattern can also be identified as a bullish or bearish flag. A flag is a continuation pattern, meaning that the price will normally breakout in the direction of the original trend.
How a rectangle pattern forms
A rectangle pattern forms in a relatively simple way. It starts when an asset’s price is rising and it hits a major resistance level. It then drops and reaches a substantial support level and bounces back to the original level of resistance. The price then drops to the support and the pattern continues for a while.
For it to be considered a valid rectangle pattern, it needs to repeat this process for two to three cycles.
A rectangle pattern can also be formed when the price of an asset is falling. In this case, it will hit a support, go back up and find a resistance, go back again and hit the support, and so on.
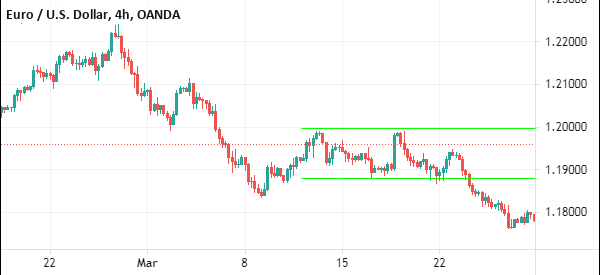
The chart below shows a rectangle pattern formed in the EUR/USD pair.
How to use the rectangle pattern
The rectangle pattern is a relatively easy pattern to identify in the financial market. It happens in all assets, including currencies, commodities, stocks, and exchange-traded fund (ETF).
To use it, you first need to look at a chart and identify the underlying patterns. Indeed, it is visually easy to identify these patterns.
After identifying the pattern, you should use the tools provided by the broker to plot the rectangle.
Strategies to use it
After this, there are two main strategies you can use to trade the rectangle pattern. First, you can place a buy order at the support level and hope that the price will rise again to retest the upper side of the channel. Second, you can place a sell order at the upper side of the channel and place a take profit at the lower side of the channel.
The main con of using the two strategies is that rectangles usually end with a breakout. Therefore, if you buy at the support level, there is a high probability that a breakout will happen and cost you funds.
Using limit orders when trading rectangles
Another strategy when trading rectangles is to use a limit order. A limit order refers to a situation where you direct the broker to buy or sell an asset at a predetermined price. In a buy stop, you tell the broker to buy an asset above the price while a sell stop is an order to sell at a lower price. A buy limit, on the other hand, directs them to buy below the price.
Therefore, in a channel, you can place a buy stop slightly above the upper resistance and a sell-stop slightly below the support level.
In this case, if there is a bullish breakout, the buy stop will be triggered, becoming the market order. On the other hand, in case of a bearish breakout, the sell stop order will become the market order.
A good example of this is shown in the chart below.
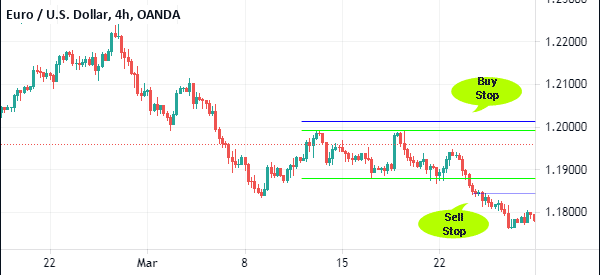
In this case, as you can see, the buy stop was not triggered. And this is fine. On the other hand, after the bearish breakout, the sell stop became the new market order and the trader benefited.
What about false breakout?
The challenge of using this strategy is when the price has a false breakout. This is where it drops below the support or above the resistance and then moves back into the channel. This is where all limit orders should always be used with a stop loss.
»How to Identify False Breakouts«
At times, it is easy to predict how the price of an asset will breakout. For example, if the pattern is forming after a strong uptrend, it can be said to be a bullish flag. Therefore, in most periods, it will break out in the upside. Similarly, if it happens after a sharp decline, there is a possibility that it will breakout lower.
Pros and cons of using the rectangle pattern
There are several pros and cons of using the rectangle pattern. First, it is a relatively easy-to-use trading pattern. You can easily see it without using any tools. Second, it is easy to use limit orders to trade the pattern. Finally, it is easy to predict where it will ultimately break out.
On the other hand, the main con of the pattern is that of false breakouts. To reduce their risks, you can use the limit orders, as we have explained above.
Final thoughts
Rectangle patterns are important and common patterns that you can use to day trade all assets. They are easy to identify and easy to use. In this article, we have looked at some of the simple strategies you can use to trade the pattern.
Is this a pattern you use, or do you prefer other trading strategies?
External Useful Resources
- Rectangle Pattern: 5 Steps for Day Trading the Formation – Trading Sim
