A few weeks ago, we looked at the Relative Strength Index (RSI), which is one of the most popular indicators in use today. You have certainly heard about the indicator if you watch popular finance shows or read any technical book on markets (or in a podcast).
As we wrote, the RSI is developed by first calculating the average gains and losses and smoothing the value. In this article, we will look at the Relative Volatility Index.
You can consider the RVI as a less known ‘brother’ of the RSI; In Fact ,when applied to a chart, the indicator tends to appear like the Relative Strength Index.
What is the Relative Volatility Index?
As mentioned above, the Relative Volatility Index is a technical indicator that is very similar to the RSI. The only difference is that the RVI is calculated using the standard deviation and not the absolute prices.
The indicator was developed by Donald Dorsey and has become popular among a certain group of traders. The indicator is not found as a default in many platforms like the MT4. It can however be downloaded and installed in these platforms.
The concept of volatility
For starters, volatility refers to the overall rate of change of asset prices. For example, if a stock remains unchanged for a month, it can be said to have low volatility. On the other hand, if it opens at $10, rises to $13, falls below $8, and then rises to $12 in a single session, it is said to be highly volatile.
Some companies in the stock market are known for their high volatility. This includes companies like the small penny stocks that are thinly traded. They are volatile because actions of a single individual can have a major impact on the stock.
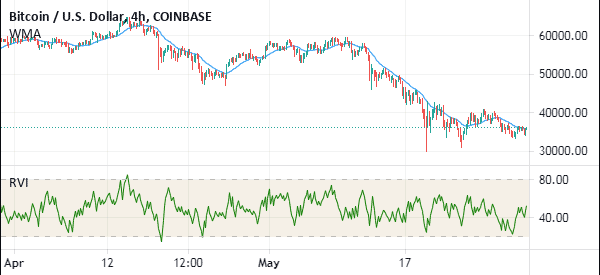
Similarly, assets like cryptocurrencies are known for their high volatility. For example, in May 2021, the price of Bitcoin dropped from $59,000 to $30,000 and then rose back above $40,000 within a few days. This is a sign that the currency is highly volatile.
Therefore, the Relative Volatility Index (RVI) is an indicator that seeks to identify the direction of the volatility of an asset’s price. The chart below shows the RVI applied in a Bitcoin chart.
In addition to the RVI, other indicators used to measure or show volatility are the Average True Range (ATR), Historic Volatility, and even Bollinger Bands.
RVI Formula
The Relative Volatility Index is calculated in a similar way that the RSI is calculated. As you recall, the RSI is calculated using the formula below:
| RSI = 100 – 100 / 1 + Relative Strength |
This formula has three parts. First, you must calculate the relative strength. You do that by first calculating the first average gain and the first average loss.
These are calculated by conducting a sum of gains over a certain period and dividing the total by the period. The first average loss is calculated in the same way. You then calculate the average gain and the average loss.
The Relative Volatility is calculated in a similar way. However, the difference is that, as stated above, it uses the standard deviation.
The standard deviation is calculated by first calculating the average. This is done by adding all the values and dividing by the period. You then subtract the mean of each number and then square the result. You should then calculate the mean of those squared differences and find their square root.
This might sound to be difficult for most traders. However, as we have written before, you just need to know how to apply and interpret the indicator.
How to add RVI in a chart
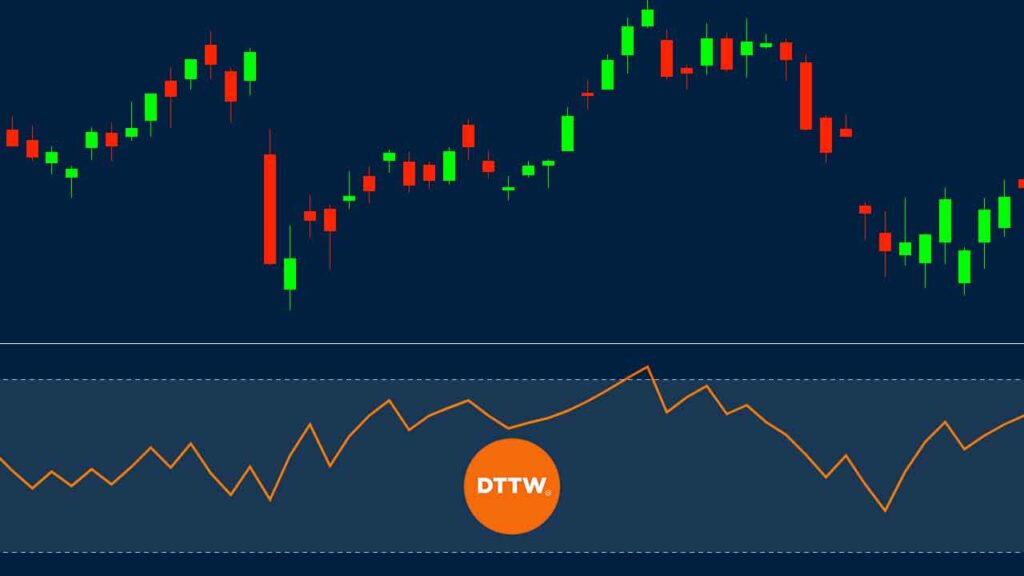
As seen above, the Relative Volatility Index is just a line that moves up and down. When adding it in a chart, you just need to select it and select the settings that you want. You can only change the colour of the indicator, the length, and the overbought and oversold levels.
How to Read and Trade with the Relative Volatility Index
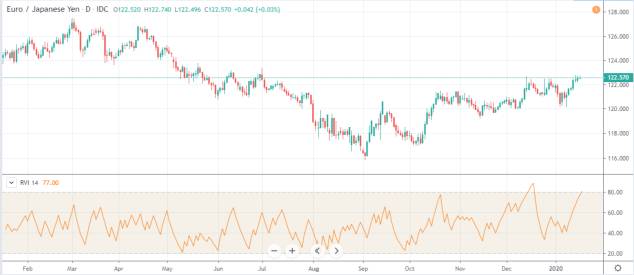
There are two main ways of interpreting the RVI. When it is applied, the RVI value moves from zero to 100. The main lines to watch are 20 and 80.
The convectional approach is to use the 20 and 80 as the oversold and overbought levels respectively. This means that you should buy whenever the price of an asset moves to the oversold level and short when the price moves to the overbought level.
»Our guide about Short Selling«
There are other traders who use a different approach.
They buy when the RVI is moving upwards and continue to hold their trades even when the overbought level is reached. They sell short the trade when the RVI is moving lower and continue to hold even when it reaches the oversold level.
The reason for this is that they believe that the momentum will not just stop when these overbought and oversold levels are reached.
»The Momentum Rule in Day Trading«
RSI vs RVI
Like the Relative Strength Index (RSI), you can also use the RVI to find divergence in an asset. Divergence happens when an asset’s price is rising while the indicator is moving in the opposite direction. When it happens, it is usually a signal that the price is about to reverse.
Another way to use the RVI is to combine it with other momentum, volume, and trend indicators. Combining is important because it helps to eliminate the likelihood of a false breakout.
»3 Key Ways To Trade Breakouts«
Summary
The Relative Volatility is not a popular indicator in the financial market. Indeed, the indicator is not provided as a prebuilt in most platforms like the MetaTrader 4 and 5. In addition, the indicator often provides the wrong signals, making it a difficult one to work with, as shown above.
External Useful Resources
- RVI example charts – Tradingview
- More about Volatility Indices – Stockcharts
