The rounding bottom pattern is a relatively popular reversal pattern that happens when a new trend is about to form. It is a pattern that has a close resemblance to the cup and handle pattern. Its opposite is known as a rounding top and can be applied on all assets like commodities, currencies, and exchange-traded funds (ETFs).
This article will look at how to use the rounding bottom pattern well and some of the strategies to use.
Reversal patterns explained
To understand the rounding bottom pattern well, we need to know what a reversal pattern is and the difference with continuation patterns.
A reversal pattern is one that happens at the end of a bullish or bearish trend. It usually results in a new trend. Some of the other popular types of reversal patterns are double and triple-top, double and triple-bottom pattern, head and shoulders, and wedge, among others.
Continuation patterns, on the hand, refer to patterns that signal that a financial asset’s price will continue moving in the original direction. Some of the popular types of continuation patterns are cup and handle and ascending and descending triangles.
What is a rounding bottom pattern?
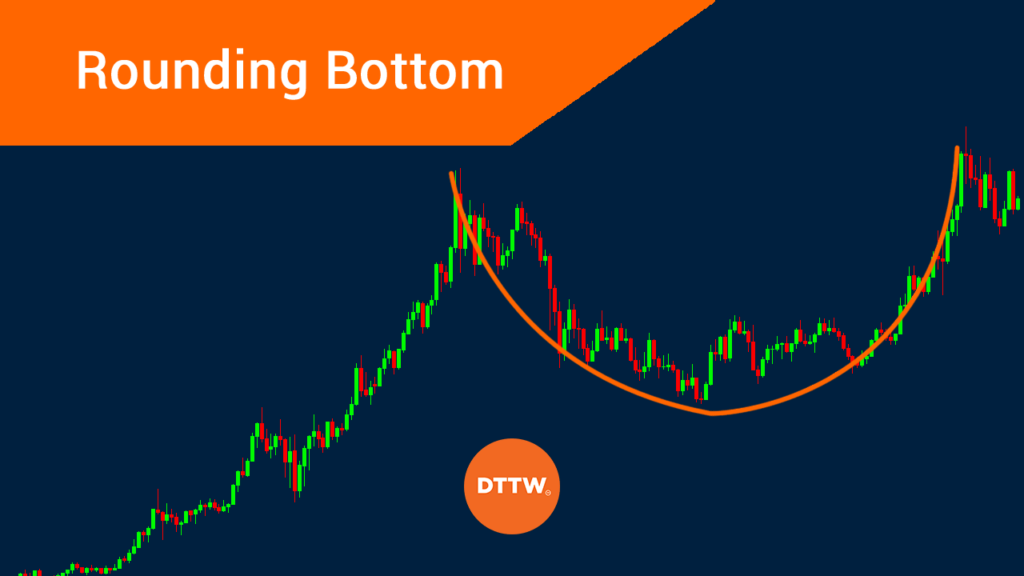
A rounding pattern is a price action pattern that resembles a cup and handle or a U shaped pattern. When it forms, it signals that the financial asset will start moving in an ascending pattern. Unlike a pattern like a V-shaped reversal, the rounding bottom takes time to form.
What does this pattern say to traders? Simply that the price is gradually changing from bearish to bullish. It is also easily identified across multiple timeframes like 30-minute, hourly, daily, and weekly.
»Multi Time-Frame Analysis Explained«
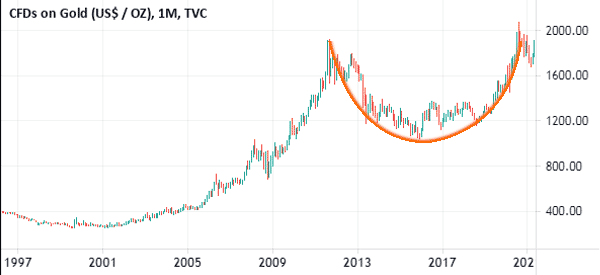
The chart below shows a rounding bottom pattern applied on the gold chart.
How the rounding bottom forms
The rounding bottom pattern works in a relatively simple way. First, the financial asset needs to move downward, signalling low demand for the asset. The formation is not characterized by excess selling. Second, the price then forms a low point and starts rising gradually.
When the upward trend starts, the key level to watch is usually the point where the downward trend started to form. This is usually the resistance point of this trend.
In most cases, as seen in the chart above, the price tends to face more resistance at this level. In fact, the price may decline or face some consolidation at this level. Some analysts call this level the neckline.
How to trade the rounding bottom pattern
Trading the rounding bottom pattern is relatively easy. First, you need to look at a chart visually (as in every circumstance when analyzing price action) and see whether you can see the pattern. As seen above, it is not difficult to identify what is of interest to us.
Use the Fibonacci Retracement
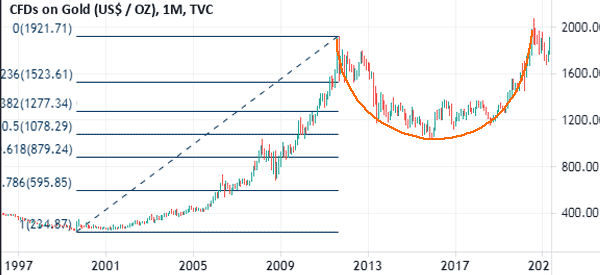
Second, at times, you could apply the Fibonacci retracement level. This is a tool that definitely can’t be missing in any of your technical analysis (and in fact we mention it very often in our articles).
The chart below shows that the lower point of the rounding bottom pattern happened at the 50% Fibonacci retracement level.
Sell Stop and Buy Stop
Third, after spotting the pattern, you can buy the asset when it reaches its lowest point and hold it until when it reaches the resistance level. You can hedge this trade by placing a sell-stop trade below the lower point of the pattern.
Doing this will initiate a sell trade, which will invalidate the bullish view.
There is another strategy of trading the rounding bottom pattern. After exiting at the resistance level, you could place a buy stop above the same level of resistance. By doing this, you will be betting that the price will continue moving in the same trend.
Take Profit
Some traders use a measurement formula to place a take-profit on their trades. They measure the distance between the resistance and the lowest side of the pattern. They then measure the same distance and place the take-profit there. While this is an effective way of trading the pattern, it does not work at times.
Break and Retest
Another strategy of trading the rounding bottom is to use the break and retest strategy. This is where you wait for a pullback that happens after a bullish breakout pattern.
Benefits of trading the rounding bottom
There are several benefits of trading the rounding bottom pattern. They include:
- Easy to see – It is a pattern that can be identified visually, meaning that you don’t need to use any tools to draw it.
- Accurate – It is a relatively accurate pattern to use in the market.
- Take-profit (TP) and stop-loss (SL) – The TP and SL levels are easy to place, unlike in other patterns.
- Similar to cup and handle – It is similar to a cup and handle pattern, with the difference being that the C&H is a continuation pattern.
The only con is that the rounding bottom pattern takes long to form.
Summary
The rounding bottom is a popular trading pattern used to analyze all types of assets like stocks, commodities, and exchange-traded funds (ETFs). The pattern is easy to use and learn. If you are a new trader, you can use a demo account to learn more about the strategy.
External Useful Resources
- How the Rounding Bottom Pattern Works – Option Strategies Insider
