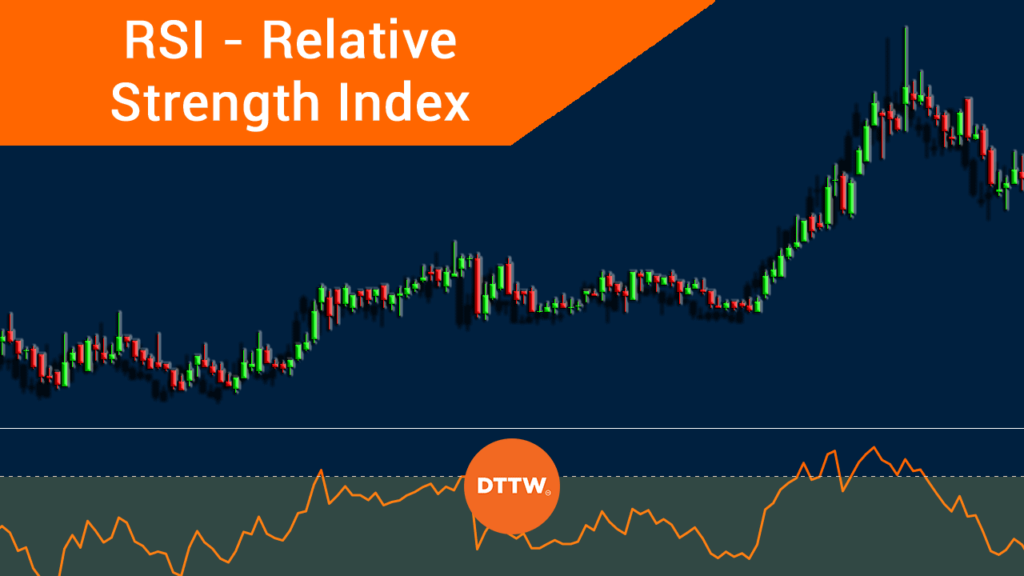
The Relative Strength Index (RSI) is a popular indicator used by both investors and traders to identify overbought and oversold levels and divergencies.
It is an easy-to-use tool, commonly categorized as a momentum indicator or an oscillator. Other similar indicators include the Stochastic Oscillator, Commodity Channel Index (CCI), and MACD.
In this article, we will look at what RSI is and how to use like a pro this amazing and flexible Technical Indicator.
What is the Relative Strength Index (RSI) indicator?
The RSI was developed in the 1950s by Welles Wilder. Wilder was a well-known trader and author who is also credited for developing other indicators. The RSI is a momentum indicator that measures the speed and change of price movements.
It is an oscillator that moves from zero to 100.
»How to Use the Momentum Rule«
RSI Calculation and Formula
The RSI is calculated using a very simple formula. First, you calculate the Relative Strength. This is done by dividing the average gain with the average loss during a particular period. The most popular period is 14 days.
You then add the RS with 1. You divide the result by 100. The final RSI number is derived by subtracting this result from 100. As with all the other indicators, you don’t need to do these calculations by yourself.
The best approach is to simply know how to apply and interpret them.
All purposes of the RSI
There are several purposes of the Relative Strength Index (RSI) in the market. Most of these reasons will be explained below. These purposes include:
- Finding extreme levels – The most popular purpose of the RSI is to find overbought and oversold levels.
- Finding divergences – Divergences happen when an asset price is moving in the opposite direction as the indicator.
- Trend following – In some cases, the RSI indicator can be used in trend-following strategies.
- Reversals – It is also possible to use the RSI to find reversals. This is similar to the strategy of finding overbought and oversold levels.
Best settings for the RSI
Like most indicators, it is always important to ensure that the settings are okay based on your trading style. The most used period in the RSI indicator is 14. However, you can always tweak this setting by lengthening or narrowing down the period.
You can also tweak the levels you want the overbought and oversold levels. The default levels are 70 and 30 but you can tweak them to suit your style. Some traders place the overbought and oversold levels at 80 and 20, respectively.
Another parameter you can change is the source of the data. The default among many platforms is that the RSI uses the closing prices. However, you can change this data so that the RSI is calculated based on the open, high, and low prices. Based on a common experience, the closing price is usually better.
How to read the RSI
As mentioned, the RSI index moves between 0 and 100. In most cases, the indicator has three important parts: 30, 50, and 70.
30 is where the indicator is oversold while 70 is where it is overbought. 50 is usually seen as the neutral point of the indicator.
Therefore, when the indicator moves below 30, it is said to be oversold. Moves below 20 signals that the indicator is extremely oversold. On the other hand, a move above 80 is said that it is extremely overbought.
RSI vs Stochastic RSI
A common question among traders is on the difference between the RSI and the Stochastic RSI. As the name suggests, the Stochastic RSI seeks to incorporate the two indicators.
It does this by measurin the level of the RSI relative to its high-low range in a period. It achieves this by applying the stochastics formular to the RSI values.
The indicator is calculated using the formula: StochRSI = (RSI – lowest low RSI)
Trading Strategies to Use the Relative Strength Index
There are several approaches of using the Relative Strength Index. First, you need to ensure that the pair is following a trend. This trend could be in each direction. The reason for this is that it is that it is usually almost impossible to get a real signal when the financial asset is consolidating. When an asset is consolidating, the RSI will often be at the middle.
Second, you need to check the period of the RSI. Most trading platforms use 14 as the default period, because it works well in most scenarios. However, you can change it depending on your trading strategy.
RSI oversold and overbought
The first common approaches to use the RSI is to identify the oversold and overbought level. A financial asset is said to be oversold when it has moved so much lower. An RSI level below 30 is said to be oversold.
Most traders view this situation as the best place to buy an asset. The opposite of being oversold is being overbought. A level above 70 is said to be overbought. Most traders use it as an ideal level to short.
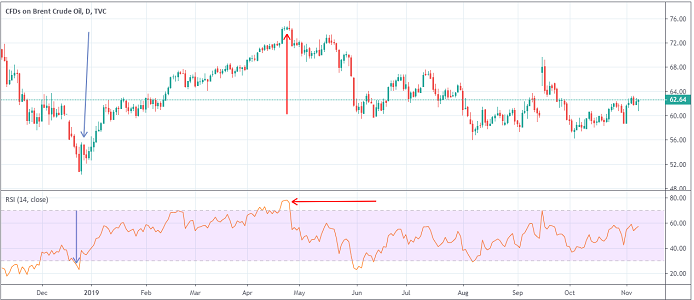
You can see a good example of this on the chart above. The blue arrows show the points when the pair was oversold while the red points show when it was oversold.
Another approach is to do the opposite. This means buying when it is overbought and selling when it is oversold. The thinking is that a pair will continue moving in one direction even after reaching the overbought and oversold levels.
The first approach is usually more appropriate because that is how most traders use the RSI. You should always ensure that you have use additional indicators. This will help you confirm a new trend and avoid a false breakout.
Using the Relative Strength to Trade Divergences
The next strategy to use when using the Relative Strength Index is to find divergences. As we have noted before, a divergence refers to a situation where an asset’s price is going in one direction and the indicator is going in the other one. Ideally, when that happens, it is usually a sign that a major reversal is about to happen.
A good example of this is shown in the EUR/USD chart below. As you can see, the pair is rising while the RSI is in an overall bearish trend. As such, there is a high probability that the price will have a bearish breakout in due course.
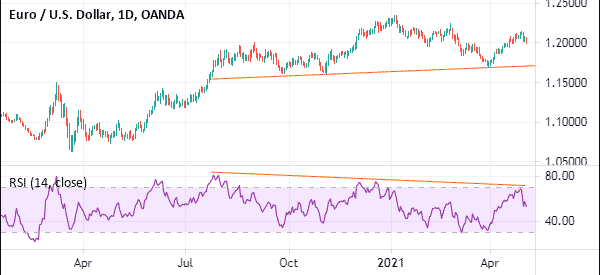
While the divergence is a good strategy to use, it takes time to form and develop and is therefore not suitable for day traders. Instead, it is mostly used by position traders who buy and hold assets for a while.
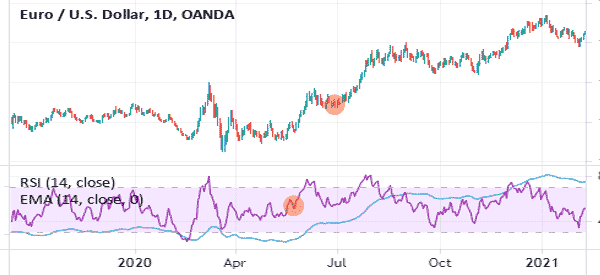
RSI overlays
Another less popular strategy of using the RSI is to identify areas where it crosses over with other indicators. The most popular one is the moving average (we will take exponential one as example). To do this, you simply overlay a moving average of the same length and identify areas where there is a crossover.
Also, you can use the strategy when trend following. For example, in the chart below, we see that the EUR/USD continued going upwards so long as the RSI was above the 14-day EMA.
Summary
In this article, we have looked at what the Relative Strength Index (RSI), how to set it up, and some of the strategies you can use to trade it. Like all indicators, the RSI is not always accurate, meaning that you should always be cautious.
External useful resources
- Is RSI a good indicator for trading and investing purposes? – Quora
- Relative Strength Index – Stock Chart School
