Multi timeframe analysis is the process of making trading decisions by looking at several timeframes first. The strategy is helpful because it helps traders identify the primary trend and potential support and resistance levels.
In this article, we will look at the multi-timeframe analysis and how you can use the rule of three to succeed.
What is multi-timeframe analysis?
As mentioned, this is a trading approach where a trader looks at several key timeframes before they initiate a trade on assets like stocks, currencies, commodities, and exchange-traded funds. It is an approach that is used by all types of traders, including scalpers, swing traders, and position traders.
When used well, multi-timeframe analysis can help you make better decisions. For example, a currency pair may be in a strong upward trend on a 5-minute chart. But when you zoom out in a daily chart, you find it in a deep consolidation phase
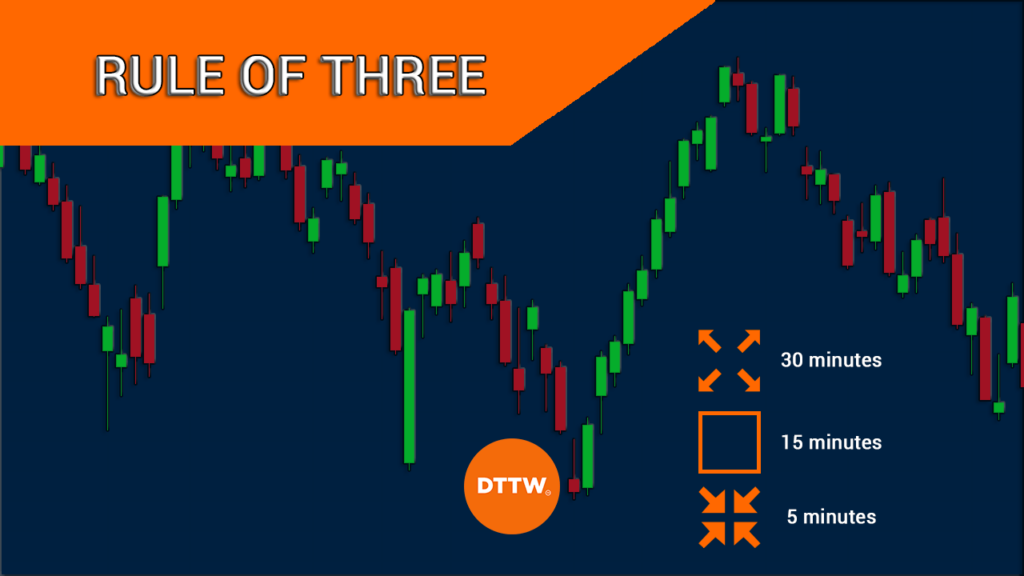
What is the rule of three in analysis?
Rule of three is an unwritten rule that recommends that a trader should use three timeframes before they initiate a trade. Proponents believe that looking at three timeframes will help a trader identify all the necessary points they need to execute a trade.
For example, a scalper who focuses on extremely short-term charts can use three timeframes like: hourly, 30-minute, and 5-minute. Alternatively, they can use a 30-minute, 15-minute, and 5-minute chart. Other scalpers start at 15-minutes and then narrow to 5-minutes, and 1-minute.
While many day traders look at multiple charts when making decisions, long-term traders don’t focus on it. That’s because many of them focus on fundamental analysis to identify whether to buy or sell a financial asset.
Benefits of this strategy
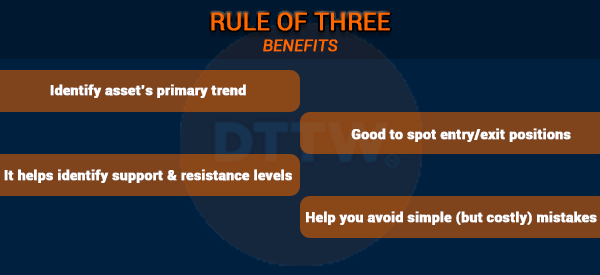
There are several benefits of using the rule of three in day trading. First, the long chart will help you identify the asset’s primary trend. As such, it will help you make better decisions in the market.
Second, it is a relatively straightforward strategy that you can use to enter and exit positions. Third, it is a rule that helps you identify support and resistance levels as as we are about to go to see in the Apple chart below.
Finally, the rule of three is an essential trading strategy since it can help you avoid making simple mistakes like entering a short trade when an asset has just moved above a key resistance point.
Why the rule of three is important
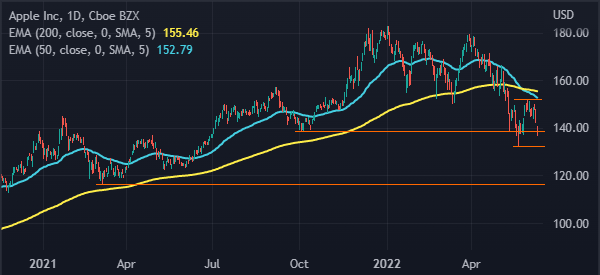
The rule of three is an important one in day and swing trading for three important reasons. First, it helps traders identify trends in the market. For example, on the daily chart below, we see that Apple shares are in an overall bearish trend.
Related » How to spot a trend early
Notably, we see that they have formed what looks like a double-top pattern and a death cross. A death cross forms when the 200-day and 50-day moving averages make a bearish crossover.
Therefore, as a day trader, you have a good idea on the overall state of the market. At the same time, we have identified key support and resistance levels in the market.
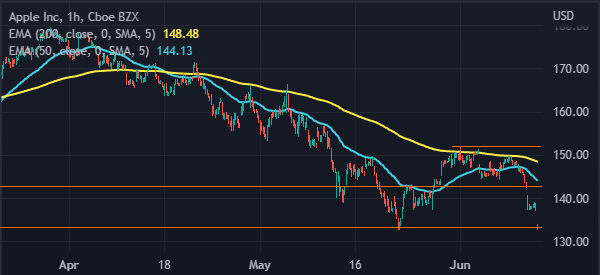
Now, when you narrow down to the hourly chart, you see that the stock is near the support level at $132 as shown below.
Confirm/invalidate primary trend
Second, rule of three is an important strategy because it helps to confirm or invalidate the primary trend. As shown above, we see that the stock is clearly in a downward trend on the daily chart. The same is also seen when you narrow it down to the hourly chart.
Find entry and exit points
Finally, rule of three can be used to define potential entry and exit positions in a trade. In the initial chart, we saw that $132.84 is an important support point since it was the lowest level on May 23rd. Therefore, you can execute a short trade and then set your take-profit at that level.
Best time combination in rule of three
A common question among traders is on the best time combination when you use the rule of three in market analysis.
There is no correct answer to this since traders use different trading strategies. For example, a scalper will often use different combinations compared to swing traders.
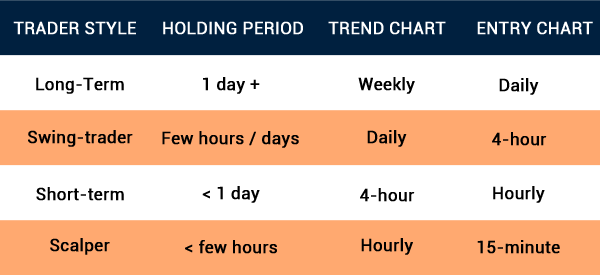
Scalpers
For s scalper, the ideal combination is 30-minute, 15-minute, and then 5 -minute. On the other hand, a trader using the 1-minute trading strategy, an ideal combination can move from 15, 5, and 1. These are the most popular timeframes.
Day traders
On the other hand, for day traders, an ideal combination can move from 1-day, 4-hour, and then 30-minute chart.
In this, the daily chart will show the primary trend while the four-hour chart will help you to confirm the initial trend. Finally, the 30-minute chart will help you execute the trade.
Swing traders
Swing traders are people who execute trades and then hold them for a few days. These traders tend to execute trades on the 30-minute or hourly chart. As such, a potential combination can move from daily, to four-hour chart, and hourly chart.
Still, it is recommended that you spend a lot of time testing several timeframe combinations to see those that work well. At times, you don’t need to stick to the rule of three. Instead, you can decide to use four charts.
Summary
Rule of three is an important trading strategy in all types of trading. It is essential because it helps to identify entry and exit trades in an easy process. It is not mandatory to use this technique to analyze a trend, but it is certainly supportive especially to avoid abnormal asset movements.
External useful resources
- Multiple Time Frames Can Multiply Returns – Investopedia
