Trend reversals refer to a situation where an existing trend changes direction either suddenly or in an extended period. When caught early, reversals can be highly profitable in the market.
For example, if a company’s stock price is in a strong bullish trend, a reversal will see it start a new bearish trend.
A good example of a trend reversal is shown in the chart below.
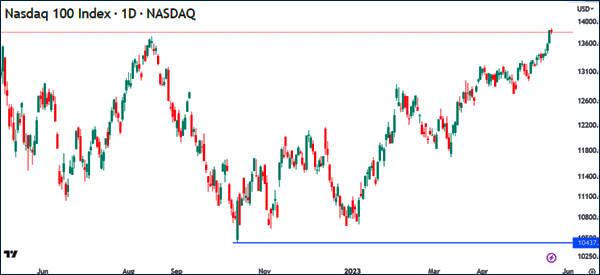
As you can see, the Nasdaq 100 index was in an extremely bearish trend in 2022. This decline saw it drop to a low of $10,437. The index then staged a strong comeback and rose to almost $14,000 in May 2023.
In this article, we will look at what a trend reversal is, how it works, and the rules to use when using the strategy to trade.
Trend reversal definition
As explained above, a trend reversal pattern is defined as a situation where an existing trend changes direction and starts a new one. As shown above, the Nasdaq 100 index was in a strong bearish trend in 2022 and then it made a strong trend reversal in 2023.
Reversals happen in all timeframes, including weekly, daily, hourly, and even in a one minute chart. Another thing is that a reversal pattern leads to a trend-following strategy.
This means that once you spot a reversal, the next strategy is similar to a trend-following since your goal is to hold it until it makes another reversal.
Identify a current trend
The first step in trading trend reversals is where you identify a current trend. This is an easy step since you can see the trend visually. For example, as shown above, we can see that the Nasdaq 100 index is clearly in a bullish trend in the daily chart.
Still, there are other things that can help you in this stage. First, look at the period selected in the chart. This is important because a stock can be in a bullish trend in the 5-minute chart and be in a strong bearish trend in the daily or weekly chart.
Second, you need to understand why the asset is in a bullish or bearish trend. Finally, some trend indicators like moving averages and Bollinger Bands can help you identify these trends.
Identify key reversal patterns
The other rule to consider is that you need to identify key reversal patterns in the market. These patterns will be useful when you are using trade reversals.
There are many such patterns, including:
- double and triple bottoms
- head and shoulders
- rising and falling wedges
- gap reversal
- pivot point reversals
- price action reversal patterns
among others.
For day traders, you should focus on chart patterns that emerge on extremely short-term charts like the 5-minute or the 1-minute charts.
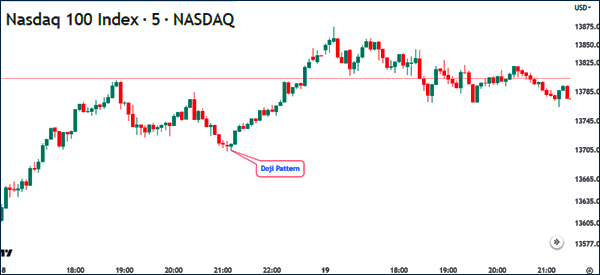
In this case, you should focus on candlestick patterns like the hammer, doji, shooting star, evening star, and morning star pattern. In the chart below, we see that the Nasdaq 100 index formed a doji candle followed by a small hammer. These patterns are some of the best reversal patterns.
Use volume
Volume is an important aspect when trading reversals. In most cases, traders confirm when an asset is about to reverse when there is adequate volume. For example, if a reversal pattern forms and is not supported by volume, it is a sign that this will be a false reversal.
Fortunately, many brokers provide infomation on an asset’s volume. If a big move happens without adequate volume, it means that this new move will likely not be a strong one. On the other hand, if there is higher volume, it means that the price will likely continue with the new direction.
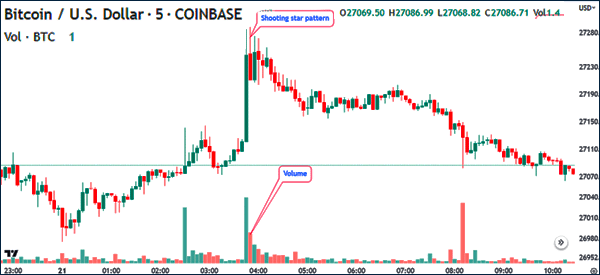
A good example of this is shown in the BTC chart below. As you can see, the BTC/USD pair formed a shooting star pattern in a high-volume environment. Since the volume was elevated, the pair then continued falling, thus confirming the trend.
Use technical indicators
The other important rule is that you should use technical indicators to identify and confirm trend reversals.
There are several types of technical indicators that you can use in day trading. The most popular ones are:
- Moving averages
- VWAP
- Relative Strength Index (RSI
- Stochastic Oscillator.
All these indicators are used differently. Trend indicators like moving averages are used to identify and confirm trends. Oscillators like the Relative Strength Index (RSI) and the Stochastic Oscillator are mostly used to find overbought and oversold levels.
For short-term traders, we recommend that you use short-term indicators. The most popular reversal indicators in day trading are VWAP (and anchored VWAP) and moving averages.
Focus on news
The other important thing you need to consider when trading reversals is to focus on the latest news. There are many news events that affect asset movements such as corporate earnings, interest rates, geopolitical events, inflation data, and employment jobs.
For example, in the Nasdaq 100 chart above, we see that the index crashed hard in 2022 as the Federal Reserve hiked interest rates. In 2023, it bounced back amid hopes that the Fed would start pivoting.
Therefore, always be in the know about the most recent and the upcoming news in the market. The use of key calendars like the earnings and economic calendar will help you in this.
Summary
In this article, we have looked at the concept of reversals and how they work. We also looked at some of the best rules to consider when using the reversal technique in trading.
The bottom line is that the reversal technique can be highly profitable but one needs to follow several rules to use it effectively.
External Useful Resources
- The Top 3 Early Signs of a Stock Reversal – Trade Smart
