Sentiment is defined as a view or opinion that a person has regarding different things or situations.
In financial trading or investing, sentiment analysis is when people use their overall attitude toward an asset to decide whether to buy or sell an asset. It is a popular approach that people use to make decisions about an asset.
This article will look at what sentiment trading is, how it works, and how to use it well.
What is sentiment analysis?
It is always difficult to determine whether to buy or sell an asset. Therefore, traders use different strategies to predict an asset’s direction.
The two most approaches are fundamental and technical analysis. Fundamental analysis is a strategy where people use news – including economic and financial data – to determine whether an asset’s price will rise or not
Technical analysis, on the other hand, refers to the use of indicators and other chart patterns to predict the assist’s direction. The most popular method of this type of analysis involves using technical indicators like moving averages and the Relative Strength Index (RSI).
Sentiment analysis comes in between of technical and fundamental analysis since all traders use it in some form. In most cases, traders use their overall sentiment of the market to make decisions.
When an asset is rising, they will often have a bullish sentiment and implement a bullish trade. Similarly, when an asset’s price is falling, their sentiment will often be bearish.
Related » What is Optimism/Pessimism Bias in Trading
Sentiment analysis vs technical vs fundamental
As described, sentiment analysis is different from other types of analysis in the financial market. At its core, this type of analysis depends on your general feeling about an asset or the broader market. You might feel that stocks will continue rising or falling.
Technical analysis, on the other hand, is relatively broader in nature because it incorporates various approaches like:
- indicators
- chart analysis
- candlestick analysis
Fundamental analysis uses other things like news and economic data to determine the direction of an asset. Some of the top economic data traders use ar
- employment
- inflation
- manufacturing
- industrial production
In stocks fundamental analysis, traders look at important news like earnings, mergers and acquisitions, and management change.
How sentiment analysis works
Sentiment analysis in trading is a relatively simple approach. In most periods, it can be compared to trend-following, where people seek to follow an existing trend.
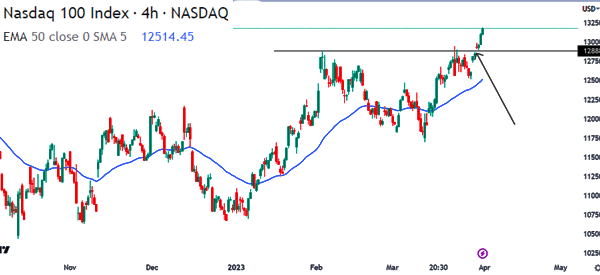
A good example of this is in the chart below, as shown, the Nasdaq 100 index has been in a bullish trend. Also, it just moved above the key resistance point at $12,888.
Therefore, in this case, a sentimental trader will likely place a bullish trade and follow the trend.
In some cases, sentimental traders with a contrarian view could decide to take the opposite trade. In this, they can decide that the bullish trend has become overdone and that the asset will likely start moving in the opposite direction.
Sentiment indicators examples
There are several important sentiment indicators that people use to day trade and invest. Here are the two most popular ones.
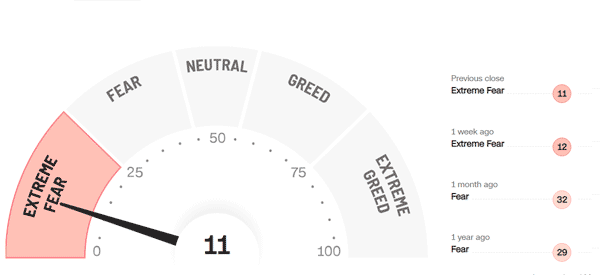
Fear and greed index
The fear and greed index is used widely in the financial market. It is a tool that looks at the two most important drivers of the financial market: fear and greed.
The index, which was created by CNN, looks at key indicators like:
- market momentum
- stock price strength
- stock price breadth
- put and call options
- market volatility
- safe haven demand
- junk bond demand
Each of these sub-indexes can also be termed as sentiment indices.
The fear and greed index moves between 0 and 100 where zero stands for extreme fear and 100 stands for extreme greed.
Traders interpret this gauge differently. Momentum investors buy when the index has moved to the greed area and vice versa.
VIX index
The CBOE VIX index is widely known as the fear gauge in Wall Street. It is an index created from looking at the options of the S&P 500 index.
The VIX rises when there is a lot of volatility and falls when there is no volatility. Some traders buy stocks when the VIX index drops while others buy them when it rises.
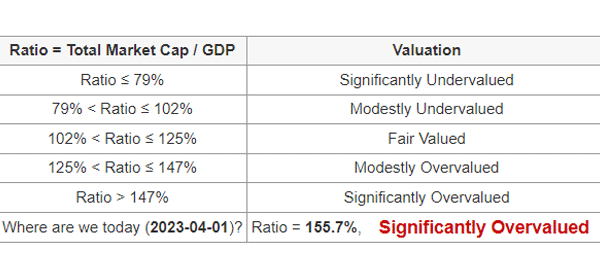
Buffett indicator
This is an indicator that was created using Warren Buffett’s principles. The indicator looks at the total market cap of companies in the US and divides by the country’s GDP.
Some analysts have modified this tool to include the total assets of the Federal Reserve. The idea is that if the ratio is below 79, it means that the stock market is undervalued. You can use the table below.
These are the most important tools. If you want to know more, we have a whole article on the best sentiment indicators.
Sentiment trading strategies
There are several trading strategies that people use when using sentimental analysis. Some of these strategies include:
News trading
News trading is a situation where people use news of the day to determine whether to buy or sell an asset. For example, if a company publishes strong earnings, the overall sentiment will be bullish.
As such, you can take advantage of this to buy the stock. Similarly, if a company publishes weak results, traders will often short the shares.
Trend trading
The other approach in sentiment trading is trend-following. This is a strategy where people wait for an existing trend and then follow it.
If the asset is rising, then the trader will place a bullish trade and vice versa. Trend followers believe that an existing trend will continue in the existing trend until something happens.
Contrarian trading
This is a risky approach where people move in the opposite of the existing trend. If an asset’s price is rising, these contrarians will tend to move to the opposite direction.
While this approach can work well, at times, it can be a highly-riskier strategy to trade during a bull market.
Summary
Sentiment trading is a popular trading strategy that everyone uses. It is a simple approach, especially when it is combined with other strategies like technical and fundamental analysis.
While the strategy works well, it has several risks such as getting caught in market hype and buying before a reversal.
External useful resources
- Does sentiment analysis work as a trading strategy in financial markets? – Quora
