Price action trading strategies focus on the movements of the market based on previous price fluctuations. With the obtained information, a trader is able to make subjective decisions on the direction of the asset.
Price action trading takes into account various technical analysis tools including high and low swings, price bands, trend lines, and charts.
As a trader, you can observe the market through simple patterns such as price bars, trend lines, or breakouts. On the other hand, you can go for a detailed combination of channels, volatility, and candlesticks.
In past articles, we have looked at several price action strategies including
In this one, let us take a look at the shooting star and how to use it in the market.
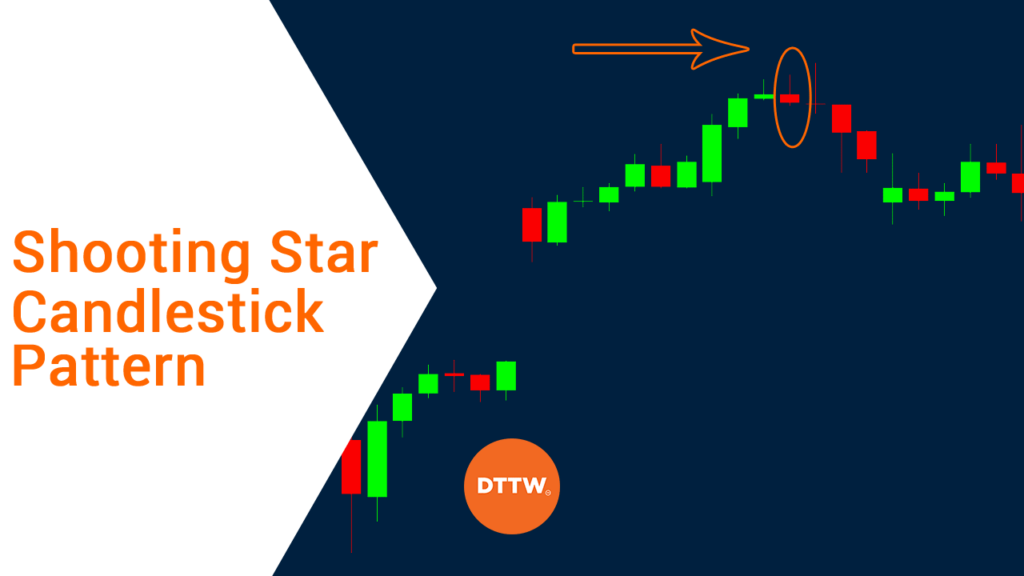
What is a shooting star pattern?
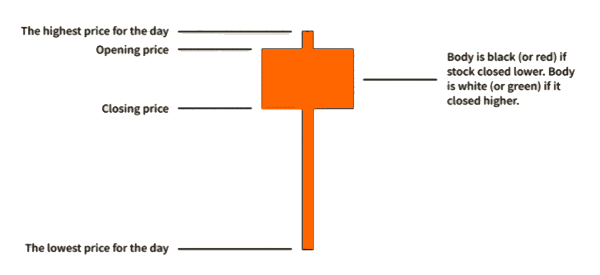
This is a bearish candlestick whose formation occurs in instances where a security opens and advances significantly, but ends up closing the day at almost where it opened. It is characterized by a long upper shadow, a small or no lower shadow, as well as a reduced real body near the day’s low.
In order for a candlestick to be termed as a shooting star, its formation has to occur in the midst of a price advance. Additionally, the stretch between the opening price and the day’s highest price has to be at least twice as big as the body of the shooting star.
The region below its real body should also have a small or no shadow.
What does shooting stars mean?
A shooting star tells you that a financial asset jumped sharply when the market or the candle opened. It then stabilized close to the upper side of the candle and then moved to the next candle.
When it happens, it tells you that the currency pair or asset may soon turn around in a bearish manner. Still, like all other candlestick patterns, it should be used using a combination of other tools.
In a shooting star pattern, the long upper shadow is usually a sign of people who bought early and are now in a loss-making position since the price slipped back to the opening.
Related » Candlestick’s shadow explained
It is worth noting that a shooting star pattern is not always a sign that a financial asset will reverse and start a new bearish trend.
Most traders usually wait for a confirmation of the pattern before they enter a trade. For example, they can look at the second and third candlesticks that form after the shooting star pattern.
How to spot it
The shooting star pattern has several key characteristics. First, it has a long upper shadow and a small or no lower shadow.
Second, it happens after the asset makes a major bullish trend. Third, it can be in either colors. Finally, you can use it to place a stop-loss or a take-profit when trading.
How to trade this pattern
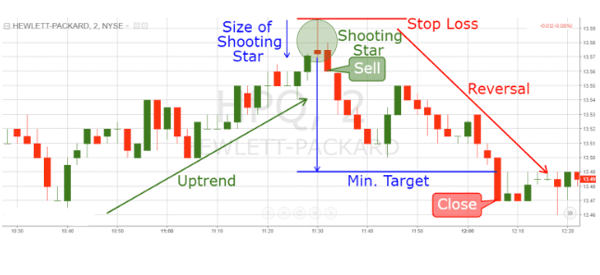
As a trader, it is fairly easy to determine your next move by using this pattern. With reference to the chart above, the expected effect is lower prices.
As such, we need to identify entities to short. Based on the observation that prices were earlier rejected at the shooting star’s high, it will be practical to place a stop loss order at the last swing high (the red horizontal line).
If you are a conservative trader, trade the wick’s retest (the black dashed line). If you are rather aggressive, enter the trade at the opening of the next candlestick.
There are other ways of trading the shooting star pattern. The most common is to use a buy-stop. When you spot it, you could place a buy-stop above the upper shadow. In this case, a buy trade will be implemented if the price moves above the upper shadow.
Alternatively, you could place a stop-loss slightly above the upper shadow especially when you are shorting the financial asset. For example, if you short an asset, you could place a stop-loss above the upper shadow.
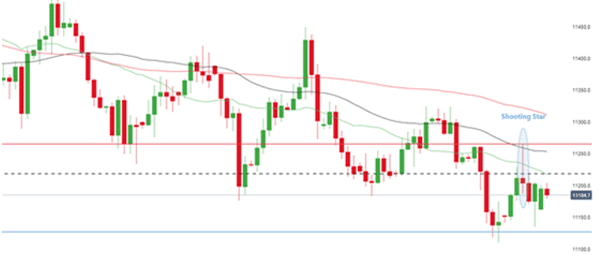
How to spot a signal using a shooting star pattern
So, how do you spot a signal using the shooting star pattern? First, you need to ensure that the asset’s price is in a bullish trend. Second, as mentioned above, this pattern is characterized by having a small body and a long upper shadow.
After spotting such a pattern, the right thing to do is wait for a confirmation that a trend reversal is indeed happening. Finally, it is recommended that you do a multi timeframe analysis to identify key support and resistance levels for your trades.
Shooting Star vs Inverted Hammer
It is easy to confuse the two candlestick patterns since they are similar in appearance. Both of them have a small or no lower shadow, tiny real bodies that are close to the candle’s lower portion, as well as long upper shadows.
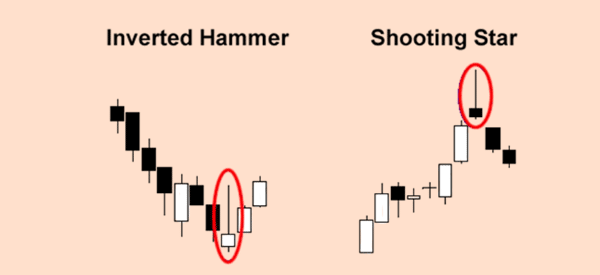
Despite these similarities, their contexts are different. On the one hand, a shooting star is formed as a result of a price advance. It usually indicates a probable turning point lower.
On the other hand, an inverted hammer results from a price decline and denotes a prospective turning point higher.
› What is a Hammer Candlestick?
Shooting Star vs Hanging Man
The shooting star pattern is often confused with a hanging man. The two are usually reversal patterns that form at the top of a major rally.
As the name suggests, the hanging man pattern happens when there is a small body and a long tail. Its formation resembles that of a man who has been hanged. It is characterized by having a small body and a long lower shadow as shown below.
The shooting star pattern, on the other hand, is the opposite since it has a small body and long upper shadow.
Benefits and Drawbacks of the shooting star candlestick pattern
Pros
- It is suitable for all traders, especially the beginners
- It is easy to identify
- As long as all the criteria are met, it is rather reliable
Cons
- It is not always reliable in defining a short trade
- One needs to use fundamental and/or technical analysis to confirm the pattern’s predictions.
FAQs
Is the shooting star a bullish or bearish pattern?
How accurate is the shooting star pattern?
However, if you use the strategies mentioned above, you will be at a good position to avoid risking too much money.
Conclusion
Similar to other price action trading strategies, the shooting star is one of the trading tools that can’t be dismissed in the trading world. Indeed, it is a simple system to identify and use.
However, it is still important to couple it with fundamental and technical analysis. You can start your financial journey today by checking out the exclusive free stock market courses by FinGrad
External Useful Resources
- The Inverted Hammer And Shooting Star Candlestick Pattern – MarketRealist
