Moving averages are among the most common types of technical indicators in the financial market.
If you watch financial media like CNBC and Bloomberg regularly, you must have heard about the indicators.
There are several types of moving averages, including exponential moving average (EMA), weighted moving average, and simple moving average.
In this report, we will look at what the SMA is and how you can use it well in the financial market.
What is the simple moving average?
The SMA is the most popular and easiest to understand type of moving average in the market. It is also the easiest one to calculate.
The average is formed by adding the total number of an asset’s price and then dividing it by the number of periods. The average is always moving since old data is always dropped as new numbers become available.
The SMA is so important such that other technical indicators have been developed from it. For example, the calculation of the EMA always starts with calculating the SMA.
Other indicators derived from the SMA are Bollinger Bands, momentum, and envelopes.
How to calculate it
As mentioned above, the SMA is calculated by adding the prices of an asset and then dividing it with the periods.
The most popular price used in this calculation is the closing price. But, you can always use the open price if it matches your trading strategy.
Here is an example of the EMA.
Assume the following are the daily closing prices of an asset: $20, $25, $23, $20, and $21. In this cases, the simple moving average for the first day will be:
($20+$25+$23+$20+$21) / 5 = $21.8
What the SMA tell to traders
The simple moving average is provided by most brokers. This means that you don’t need to know how to calculate it.
Instead, you can just apply it in the trading platform and interpret it.
Unlike most technical indicators, the SMA does not tell you when to buy or sell an asset. Instead, it shows you the direction in which the asset is trading.
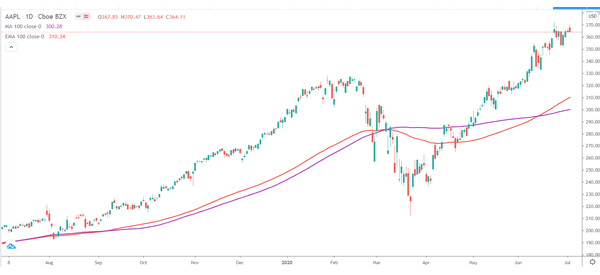
The chart below shows a 100-day SMA (purple) and 100-day EMA (red) applied on an Apple chart.
SMA vs EMA
A common question is on the difference between the Simple Moving Average (SMA) and the Exponential Moving Average (EMA).
The two indicators are relatively popular and similar as well. As shown above, in the calculation of the SMA, each period is taken equally.
For example, if it is on a Friday and you are calculating the 5-day SMA, each of the previous days will be viewed in the same lens. As such, the SMA tends to have some noise, which analysts are keen to get rid of.
Therefore, the EMA attempts to remove this lag by putting more weight on the most recent data. There are three steps of calculating this indicator. First, you need to find the period’s simple moving average.
Second, you need to use a multiplier that you will use to smoothen the SMA. In the final step, you use the following formula
EMA: {Close – EMA(previous day)} x multiplier + EMA(previous day).
In our experience, We have found the exponential moving average to be a better indicator than the SMA. A good example of this is in the daily chart below. As you can see, the 50-day EMA has a better response rate than the 50-day SMA.
Simple Moving Average Trading Strategy
There are
There are two main approaches of using the SMA indicator. The most popular is to use it to find reversals in the market.
You achieve this by combining a long-term moving average with a short-term average and then identifying where they overlap. The place where the two crossover is usually a sign of a reversal.
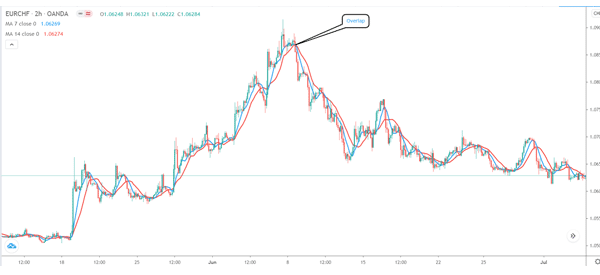
A good example of this is shown in the two-hour EUR/CHF pair.
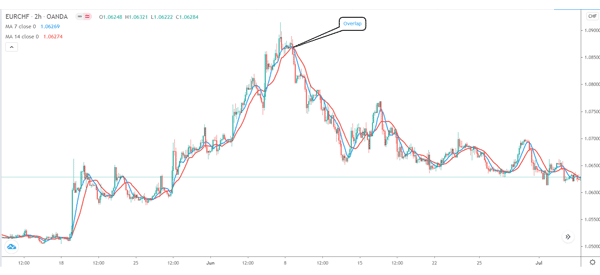
In this chart, we added a seven-day SMA and a fourteen-day EMA. A longer-term sell signal emerged when the longer-term and shorter-term moving averages made a crossover.
A buy signal was created when the two moving averages made a cross over as shown below.
You can also use SMA in trend following. This is where you identify a good SMA figure to use and then implement it in a trending chart. If the chart is rising, you should assume that the trend will remain as long as it is above the SMA.
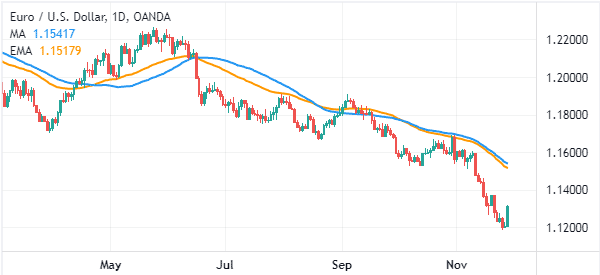
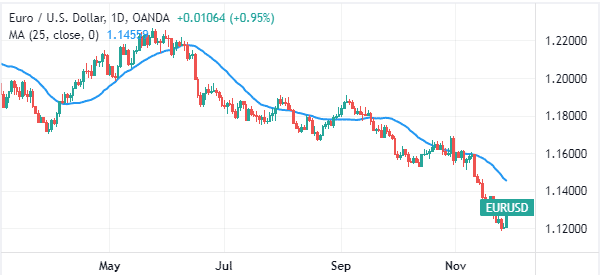
Similarly, if the chart is falling, the bearish trend will continue as long as it is below the moving average. For example, in the chart below, we see that the EUR/USD pair is in a steep downward trend. In this case, a trader can assume that the bearish trend will continue as long as the price is below the 25-day moving average.
Key Focus
There are several things you need to know. First, as you can see above, the signals tend to be lagging. That is because moving average is a lagging indicator that uses previous economic data.
Second, longer durations will create more lagging signals.
Third, you can add a third moving average to generate better signals.
Advantages of simple moving averages
There are several benefits of using simple moving averages when trading.
- Easy to calculate – Unlike other indicators that we have covered before, SMA is relatively easy to calculate.
- Easy to use – As shown above, SMAs are easy to use in the financial market.
- Used widely – Unlike other indicators we have covered before, SMAs are used widely in the financial market.
- Can be used with other indicators – Among the most popular indicators used together with SMAs are MACD and Bollinger Bands.
Cons if using SMAs
There are several cons of using SMAs.
- They lag a lot – As shown above, SMAs are known to lag a lot. Therefore, you need to wait for a while once a crossover is made.
- They mean little when used alone – When used alone, a single SMA shows little in the market.
Final thoughts
SMA is an important technical indicator used in the financial market. Unlike crossovers, there are other ways you can use it.
For example, you can use it to identify support and resistance levels. Also, you can use it to identify key levels; for example, most long-term traders look at the 100-day and 200-day SMAs to judge a trend.
We recommend that you take time to develop your own SMA trading strategy.
External Useful Roseurces
- How to Use a Moving Average to Buy Stocks – Investopedia
- Simple, Exponential, and Weighted MA – TheBalance
