Candlestick pattern are important patterns that happen in candlestick charts that can be used to predict whether an asset price will continue rising or falling or whether a reversal will happen.
There are many continuation and reversal candlesticks in the market. Some of these need multiple candles to confirm signals, while for others a single candle is enough.
In this article, we will look at single candlesticks and how you can use them in the market.
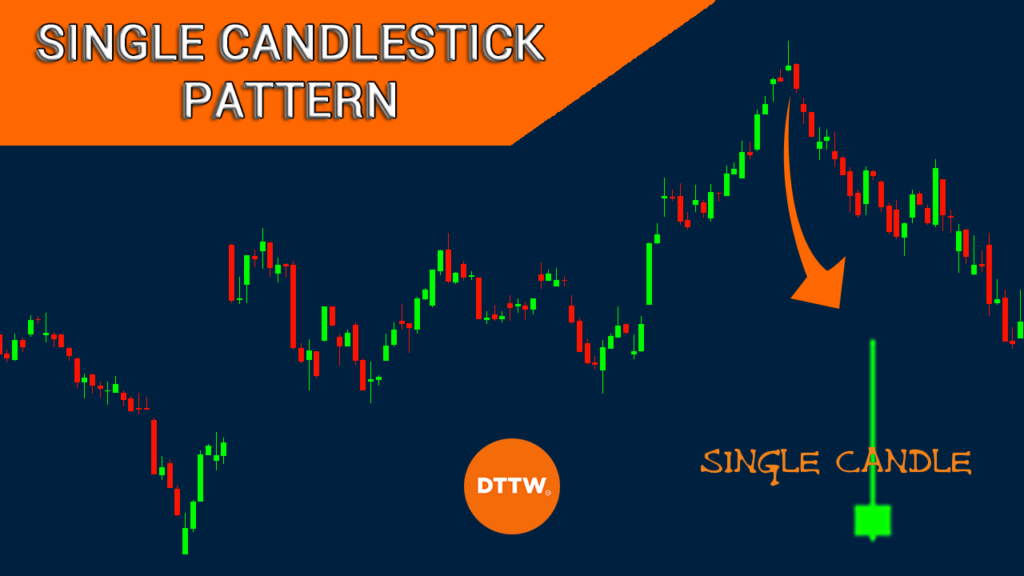
What is a single candlestick?
A single candlestick is one that has been formed by just one candle. These patterns differ from other types of candlesticks that happen when we consider a more extended timing.
Examples of patterns that have two or more candlesticks are:
- engulfing
- three dark crows
- three white soldiers
- bullish and bearish block reversal
- piercing
- matching low
- pin bar
among others.
Candlesticks vs chart patterns
A common question among traders is the difference between candlestick patterns and chart patterns. Candlesticks are those patterns that are formed by either one or two candlesticks.
Chart patterns are those that form in a certain period of time. These patterns are usually divided into continuation or reversal. Continuation patterns like ascending and descending triangles, cup and handle, and bullish and bearish pennants and flags.
Reversal patterns like wedges, double and triple tops, and head and shoulders patterns usually signal that an asset price will start a new trend.
Examples of single candlesticks
There are several types of single candlesticks that you can use in trading all assets like stocks, forex, commodities, and exchange-traded funds (ETFs). Let’s see together some of this popular single candle patterns.
In these examples we will make many references to the candle shadow. If you were not clear on the concept, you can learn more about the importance of the shadow in candlestick charts here.
Doji
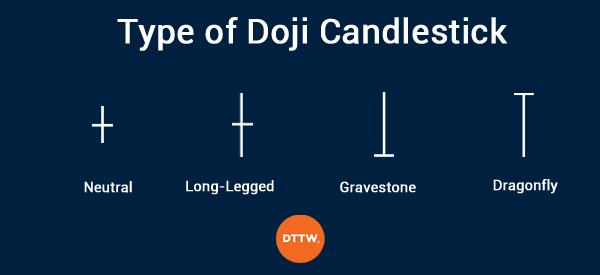
A doji pattern is a single candlestick that is formed when an asset’s price closes where it opens. The standard doji looks like a plus sign. Other types of doji are gravestone, long-legged, and dragonfly doji pattern.
A gravestone doji happens when a price has a small lower shadow and an extremely long upper shadow. It has an extremely small body.
A long-legged doji is formed when it has a long upper and lower shadows. Finally, a dragonfly doji, on the other hand, has an extremely small upper shadow and a long lower shadow.
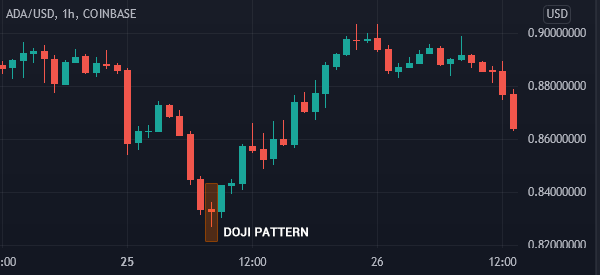
In most cases, a doji pattern is usually a sign of a reversal. When it happens during an upward trend, it usually leads to a downward reversal. On the other hand, when it happens in a bullish trend, it usually leads to a bearish reversal.
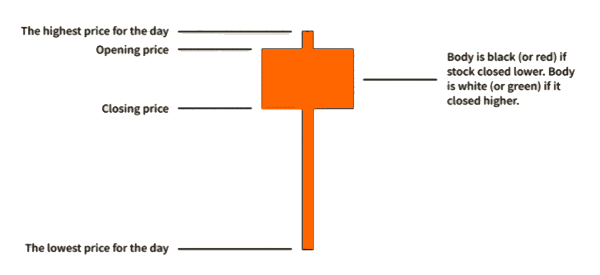
Hammer
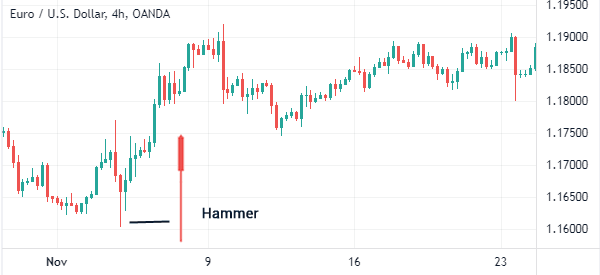
A hammer pattern is a single pattern that resembles a real hammer. It is characterized by a small body and a long lower shadow. In most cases, the candle is made up of a bearish candle, that is mostly red in color.
A hammer pattern forms when an asset is in a downward trend. As it forms, an asset tends to open sharply lower and then close slightly higher than where it opened.
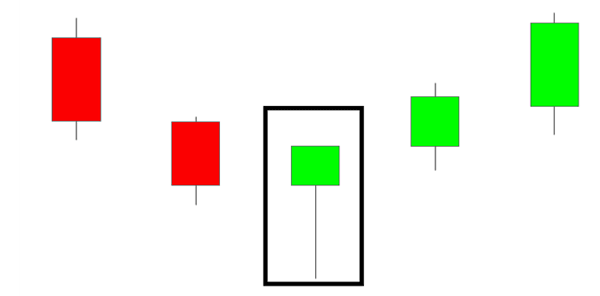
It is relatively easy to trade the hammer pattern. When it forms, you can trade by setting a buy stop slightly above the upper side of the hammer and stop-loss at the lower side of the hammer. The chart below shows a good example of a hammer pattern.
Inverted hammer
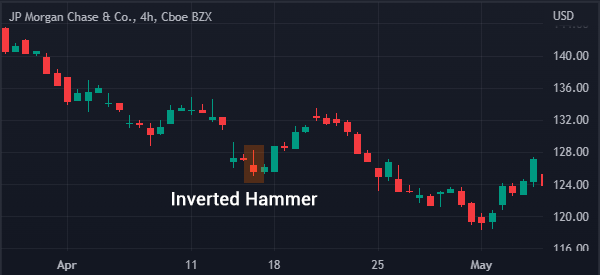
An inverted hammer pattern is the opposite of a hammer pattern. It happens when an asset’s price forms a small body and a long upper shadow when it is in a downward trend.
When it forms, it is usually a sign that the bearish trend is ending. A good example of this is shown in the chart below.
Marubozu
Marubozu is another popular type of single candlestick pattern that happens without an upper or lower shadow. It resembles a block that has no shadows.
There are three main types of marubozu: Marubozu open, Marubozu close, and Marubozu full. The three patterns are shown in the chart below.
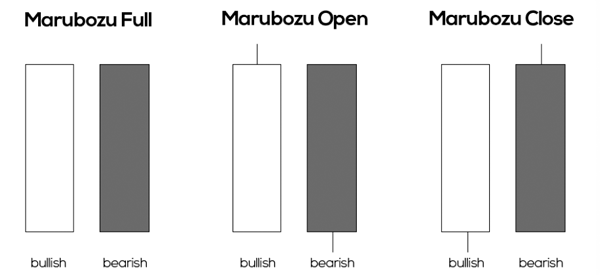
Trading the Marubozu candles is relatively difficult since they are usually neither bullish nor bearish. The best strategy to use when you identify the pattern is to wait and see how it develops.
You can then place a buy-stop and a sell-stop above the candle and below the candle.
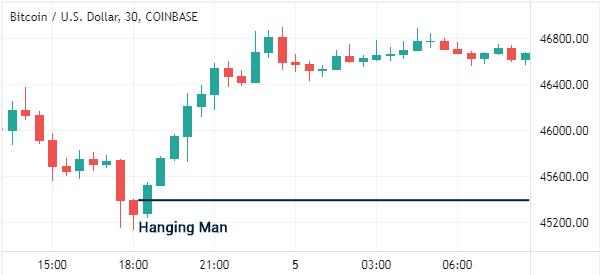
Hanging man
A hanging man candlestick is one that is the opposite of a hammer pattern that happens in a bullish trend. It is characterized by a candle that has a small body and a long shadow.
Trading the hanging man is similar to that of the hammer pattern. You can place a sell-stop pattern below the lower side of the hammer and a stop-loss above the upper body. In this case, the sell-stop will be triggered and continue for a while.
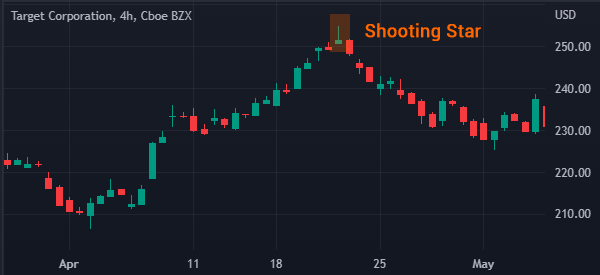
Shooting star pattern
A shooting star pattern is the opposite of the hanging man pattern. It has a small body and a long upper shadow that happens during an uptrend.
In most periods, a shooting star pattern happens during an uptrend and leads to a new bearish trend. When it happens, the asset tends to move downwards as shown in the chart below.
Are single candlesticks reliable?
A common question is whether these candlesticks are reliable or not. The reality is that most of these patterns, especially hammer, doji, and shooting star patterns are highly accurate. However, these patterns do not always lead to the continuation or reversals that we have talked about.
Therefore, it is recommended that you should focus on testing and waiting for the confirmation to take place. In this case, when a hammer forms, you should wait before you enter a bullish trade.
Also, we recommend that you do a multi-timeframe analysis and combine with technical indicators to determine whether to buy or sell an asset.
Summary
In this article, we have looked at some of the most common types of single-line candlestick patterns. We have identified the most popular patterns like doji, marubozu, and hanging man.
Most importantly, we have identified how they work and some of the best strategies to use.
External useful resources
- Most Important Single Candlestick Patterns To Know – Forex Training Group
