Company research is an important part of your career as a trader or investor. As part of your career, you will encounter new companies on a daily basis.
Before you invest in a company, you need to conduct an in-depth analysis. This is because you want to invest in a good company that is underpriced.
In this article, we will guide you through several stages you need to follow when identifying a good company to invest in after understanding its strengths, weaknesses, opportunities and threats.
In other words, we will guide you on how to do an in-depth company research.
Identify a company
The obvious first step is to identify a company. There are thousands of publicly listed companies so finding one is a bit challenging.
One way to identify a company is to screen the companies based on a certain criterion. You can find screeners in Yahoo Finance, Bloomberg apps, and MSN Money app. The idea here is to find a company that is underpriced.
Of Course, we have our own screener in Ppro8.
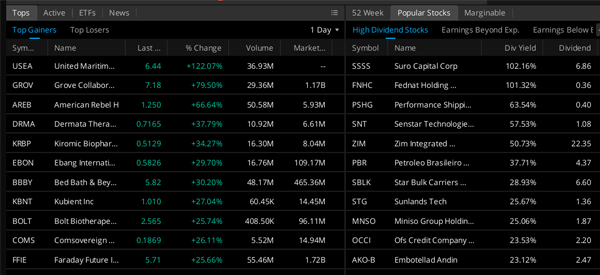
Another way to identify a company is to use tools that provide important information about companies. Some of the most important information are pre-market gainers and losers, stocks hitting their 52-week highs and lows, high dividends, and most active.
The chart below shows some of these names. You can move from company to company and learning more about them.
General Overview
After finding a company that meets your criteria, you should now do a preliminary review of the company. This involves reading the general information about the company.
The information you will be looking here might include:
- company’s management team
- recent news about the company,
- the competitive edge
- the general trends in the market
The latter is very important because you don’t want to invest in companies that are out of favor with the public.
Related » Why You Should Know Market Sentiment
For instance, in an era when retailers are shutting down, you don’t want to be investing in mall REITS.
Investor relations
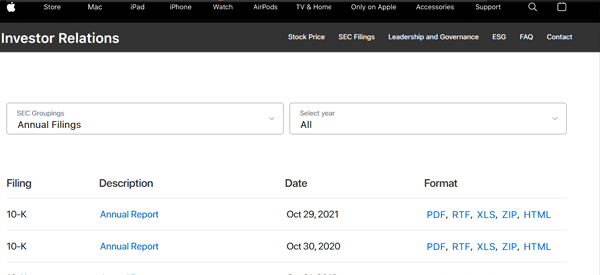
At times, looking at a company’s website will not provide you with adequate information. Therefore, for American companies, We recommend that you check a filing known as 10k, which is also known as the annual report.
This report will give you all information you need about a company, including its business segments, risks, compensation, and revenue growth.
You can download the 10k filing in a company’s investor relations page as shown below. Alternatively, you can find it in multiple platforms like SeekingAlpha and Guru Focus.
Qualitative factors
There are several qualitative factors you should always focus on when researching stocks. Some of the most notable ones are:
- Who are the biggest holders of the company?
- Do insiders like the CEO and board members have a skin in the game?
- What is its competitive advantage?
- How are its supply chain dynamics structured?
- What is the track record of its management?
Financial Information
This is where you look at the company’s financials. It is one of the most important things you can ever do because you can tell a lot about a company based on its financials.
You should look at the income statement, balance sheet, and the cash flow statement.
Income Statement
The income statement shows the company’s revenues and all the expenses. Ideally, you should invest in a company that shows increasing revenues and decreasing expenses.
Previously known as a profit and loss account, income statement is so important because it shows you how the money is flowing.
The income statement has several parts. It always start with revenue followed by cost of revenue. The difference gives you the gross income.
In the next part, the company lists all its expenses. Most companies divide these into SG&A, R&D, interest expenses, and other expenses. The difference between gross profit and expenses gives you operating income.
In the next part, the company deducts other expenses like taxes. This leads to the net profit or loss, which is expressed in full and on a per share basis.
Balance sheet
The balance sheet shows the company’s assets and liabilities. You should chooese a company with more assets and little liabilities.
If a company has debts, you should check at the expiry periods of these debts and whether the company will manage to pay them.
The balance sheet is made of two important sections. The first one is the total assets and the other one is total liabilities. It can also include other sections like total equity and total common shares outstanding.
Cash Flow Statement
The cash flow statement shows how the company is using the net income. Ideally, you should invest in a company that has increasing free cash flow.
Cash flow has three parts starting from cash from operations followed by cash from investing activities and cash from financing activities.
Growth
You want to buy a company that shows huge potential in terms of growth. For instance, the reason why Amazon is an expensive company is because investors are hoping that its many initiatives will bear fruits.
Growth is an important part of most companies, especially those in the technology sector. It simply refers to how a company’s revenue, EBITDA, and profits are growing. In most cases, investors focus on YoY growth, which compares two equal periods of the year.
Some companies, especially new ones tend to show some excellent growth since they come from a low base.
On the other hand, investors are usually comfortable investing in quality companies that don’t have a lot of growth. These firms are known as value stocks and they include firms like Unilever, P&G, and AT&T.
Valuation
After After your company research has helped you find a stock with increasing revenues, increasing assets, and an increasing free cash flow, you should go to the company’s valuation.
The company might have the best financial figures but be expensive. You don’t want to buy a company that is expensive.
To value a company, you first need to find the multiple that investors are paying for. Here, you should use the Price to earnings ratio, price to sales ratio, and the EV to EBITDA ratio.
Then, you should compare these numbers with the company’s peers. If the numbers are lower than the peers, this is an indication of a company to buy.
But this is not the final step.
If the company is undervalued, you should ask yourself why. Take time and read the recent news and find out why investors are not overly interested in the company.
You can also use the Discounted Cash Flow method to find the company’s present value.
Rule of 40
There is another way of valuing high-growth companies that is known as the rule of 40. The concept involves looking at the company’s growth and margins. If the total of the two is above 40, it means that the company has a good valuation.
For example, after Q2-2022, DocuSign had a YoY revenue growth of 37% and an EBITDA margin of 2%. This means that it has a rule of 40 total of 39%. Therefore, it is a sign that the company has some challenges.
Final thoughts
For long-term investing, it is very important to take time to do intensive research. This should take a considerable amount of time to complete.
For traders, all this is not necessary because you don’t intend to own the company for a very long time.
External Useful Resources:
- What are the top 5 things you research before investing in a company on the stock market? – Quora
