Technical indicators are the foundations of day trading. Without them, it is impossible to make profitable trades (unless you rely only on patterns). They are used by all professional traders including those who work in large Wall Street banks.
To new traders however, the indicators appear as complex tools that might seem confusing. The truth is that you don’t need to know how they are calculated, but only how best use them!
In this article, We will look at some of the best indicators you can use in your trading. However, it is important to note that you are free to use other indicators that suit your trading style.
Further, you should not fall into the trap of overusing the technical indicators: in fact, the fewer you use, the better it will be for you.
What is technical analysis?
Technical analysis is a method of studying chart patterns with the goal of predicting the next major moves. It is a popular approach used by both investors and day traders.
A comprehensive approach of technical analysis involves using a combination of technical indicators and looking at candlestick and chart patterns.
Candlestick patterns are made up of one or two candles. They include patterns like harami, hammer, shooting star, and morning star among others.
On the other hand, chart patterns take a longer period to form. They include cup and handle, bullish and bearish flag, head and shoulders, and rising and falling wedges.
In this article, we will focus at the best technical indicators to use in day trading. Please keep in mind that there are several types of indicators, each one suitable for a certain type of analysis.
First, there are trend indicators that are mostly used in trend-following and reversals. Second, there are oscillators that are mostly used to identify overbought and oversold levels.
Third, there are volume indicators that show flows of volume in an asset. In most cases, these indicators are used by swing traders and investors.
The best technical indicators
Moving Averages
These are the most common indicators. There are three common types of MAs:
- Simple Moving Average (SMA)
- Exponential Moving Average (EMA)
- Smoothed Moving Average
The SMA is calculated by adding the prices of the securities and then dividing by the number of periods. The EMA is calculated by calculating the SMA and then using a multiplier to add more weight into it.
The best way for using the moving averages is to use two MAs in one. This is common in what is known as the moving average crossovers.
Related » Moving Averages for Technical Analysis
A common type of a crossover pattern is known as a golden or death cross. Golden cross is when the 200-day and 50-day moving averages make a crossover when an asset is rising. A death cross happens when the price is falling.
Many day traders use a modified version of these crosses by using shorter timeframes like 25-day and 15-day.
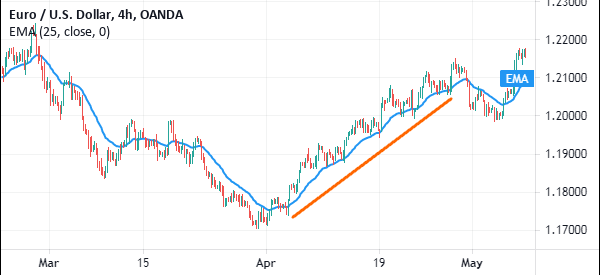
Another way of using moving averages is in trend-following. If an asset is rising, you simply add your preferred moving average and then follow the trend. A reversal or the best place to exit is when it moves below the moving average.
A good example of this situation is shown in the chart below. In this case, a buyer would have bought and held the position as long as it was above the moving average.
Bollinger Bands
Bollinger Bands are trend indicators that have three lines. The middle line is the moving average for the pair while the upper and lower bands are standard deviations of the pair.
A buy signal emerges when the pair touches the lower band while a sell signal emerges when the price touches the upper band.
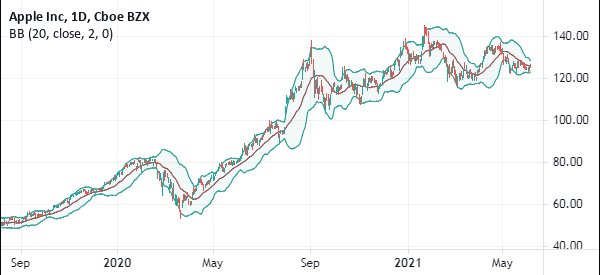
Another way to use Bollinger Bands is to use it in momentum trading. The idea is to buy an asset when the price is moving along the upper side of the Bollinger Bands and vice versa.
As shown below, a buyer could buy the asset and maintain the position as long as it is along that line.
Momentum Indicator
The goal of most traders is to enter a trade and ride the momentum. In this, when the price of a security is moving up, the trader opens a buy trade and when the price is falling, they short it.
The momentum indicator can help you know when the strength of the trend is continuing. When the trend is rising, the momentum indicator will move upwards and when the downward momentum is continuing, the momentum indicator will move downwards.
MACD
The MACD stands for Moving Average Convergence Divergence. It is another important and common indicator that is used to identify buy and sell signals.
The buy signal is generated when the signal line crosses the MACD line going upwards. A sell signal is generated when the two lines cross one another heading downwards as shown below.
The MACD is created by simply converting moving averages into oscillators. In addition to the other approaches, you can use the indicator to find divergences.
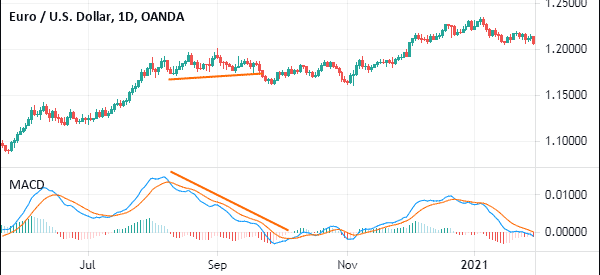
A divergence happens when the indicator is moving in an upward trend while the price is falling and vice versa. However, these divergences take a long time to form.
A good example of this pattern is shown below. As you can see, the asset is rising while the MACD has lost the momentum. Therefore, this could be a sign that the rally is starting to lose steam.
Relative Strength Index (RSI)
The RSI is an oscillator indicator that is used to identify overbought and oversold signals. When a security is overbought, it is usually a signal to sell and when it is oversold, it is a signal to buy.
In most cases, the overbought level is usually noted as 70 while the oversold level is at 30. Some traders adjust these figures to 80 and 20.
There are several ways of using the RSI. The most common way is to buy an asset when it becomes oversold and vice versa.
Still, some traders do the opposite, where they buy when it moves to the overbought level and short when it moves to the oversold point. Their argument is that the existing momentum will continue.
Another way of using the RSI is divergence. Like the MACD, this situation happens when the price is rising while the Relative Strength Index is falling.
Volume Indicator
Volume indicators are very important when you want to confirm the direction of a trend. For example, when you are waiting for a breakout to happen, the volume indicator will help you confirm the breakout. When there is a breakout with low volume, this is often an indicator of a false breakout.
Other than these indicators, other technical tools like the Fibonacci Retracement can help you identify the key entry and exit levels.
How to use technical indicators like a pro
There are hundreds of technical indicators in the market today. You can even create the indicator yourself. However, there are three main tips that will help you use these indicators like a pro.
First, ensure that you have a good understanding of the indicators you want to use. As we said at the beginning of the article, you don’t have to figure out how to calculate it… but you certainly need to know how to use it!
Second, become an expert in just a few indicators. Some professional traders use just one indicator such as moving average or VWAP. Others rely on indicators like the Relative Strength Index (RSI) and the MACD. In other words, don’t try to master all of them.
Finally, always test the indicator well before you start using it in a live account. You can master it in a demo account that does not put your account to risk.
External useful resources
- Learn more on Investopedia
- Discover more on Marketthinktank
