Moving averages are popular technical trend indicators in the financial market. The indicator is used to show the average price of an asset in a certain period. Averages are also important building blocks of other popular indicators like Bollinger Bands and Envelopes.
There are several types of moving averages like simple, exponential, and weighted. In this article, we will look at the Smoothed Moving Average (SMMA) and some of the strategies you can use to trade it.
What is the Smoothed Moving Average?
Ideally, the foundation of moving averages is the simple moving average. It simply looks at an asset’s price and divides it by the sessions under study. This means that the indicator takes every periods equally when it is being calculated.
The other types of averages aim to remove this lag by adding some considerations. For example, the exponential moving average considers all periods but it puts more emphasis on the recent data.
The smooothed moving average, on the other hand, takes all periods equally but it removes the short-term market fluctuations. As such, it helps to traders to view trends more easily.
The chart below shows the JP Morgan stock with the simple moving average (red), exponential moving average (blue), and the smoothed moving average in black. As you can see, while all these MAs have the same period, they have different results when used in a chart.
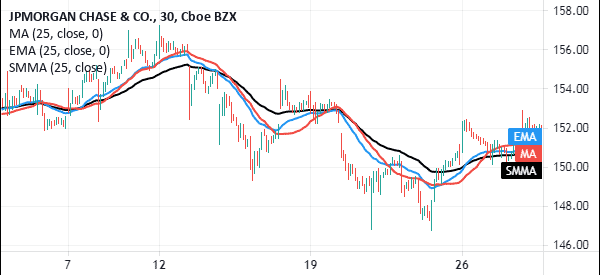
JP Morgan stock with moving averages
How the SMMA is calculated
The formula of calculating the SMMA indicator is a relatively complicated one. Still, as a day trader, you can easily do without knowing the entire formula. Furthermore, the indicator is provided by default in most trading platforms like TradingView and MetaTrader.
The formula is as shown below.
| SMMAi = (Sum – SMMAi-1) / N |
In this case, the sum is the sum of the of the source prices of all periods while N is the number of periods. Price, on the other hand, is the source price of any period that is participating in the period.
How to use the Smoothed Moving Average (SMMA)
There are several strategies of using the SMMA indicator. The common denominator is that it works well when there is an upward or downward trend that is underway. Let us look at some of the top strategies to use.
SMMA in trend following
Trend following is a trading strategy that revolves around buying a financial asset whose price is already rising and shorting one that is already falling. It is a popular trading strategy that works.
In this case, the smoothed moving average is used to guide a trader about whether to continue holding the position or not.
For example, when the price is in an overall upward trend, the SMMA indicator will remain below it. As the trend nears its end, it will start to move closer to the indicator. To use the strategy well, you need to identify the right period to use with the indicator.
A good example of this is shown in the JP Morgan chart below. As you can see, the shares are in an overall bullish trend. As this happens, the price is above the moving average, meaning that bullish traders should hold the stock. In this period, sell signals emerge when the shares start crossing the indicator.
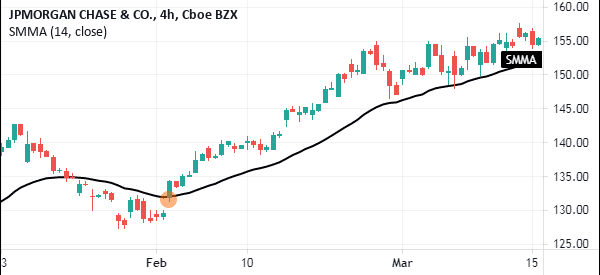
SMMA trend following exampleThis is one of the most effective day trading strategies in the market and it works across the asset classes.
The second example shown below is the USD/TRY pair. As shown, the currency pair remains above the moving average as the pair rises. As it consolidates, the price remains inside the moving average, meaning that it is not an ideal buying price.
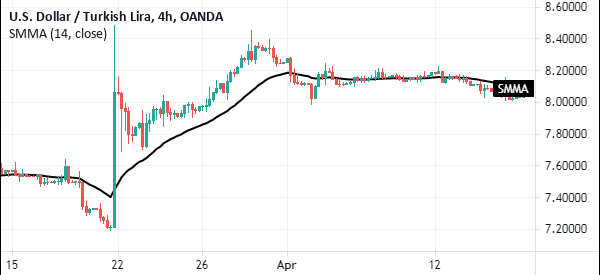
SMMA in USDTRY
Using Smoothed moving average in reversals
Another strategy of using the SMMA indicator is to identify reversals. A reversal refers to a situation where a financial asset ends a trend and starts a new one. In a reversal, a bullish trend reverses and forms bearish trend and vice versa. This is an effective strategy of using the Smoothed Moving Average in trading.
The SMMA can be used in trading reversals in several ways. The most effective one is where you use two moving averages of different lengths to trade it. The idea is that a reversal will happen when the short and relatively longer-term moving averages make a crossover.
If they make it after a strong downward trend, it is a sign that a new bullish trend is about to start. On the other hand, if they make it after a strong upward trend, it is a sign that a new bearish trend is about to start.
On the chart below, we see that the currency pair made a bullish and bearish crossover when the indicators crossed over.
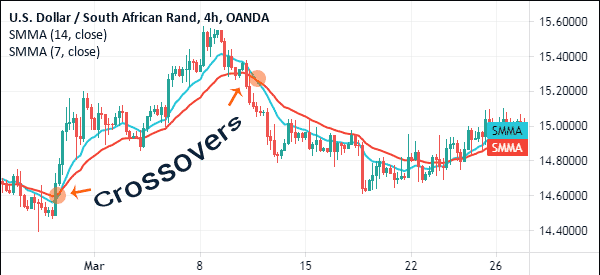
SMMA crossover exampleFor long-term traders, this type of crossover is known as a golden cross and death cross. The golden cross happens when the 50-day and 200-day SMMA indicators make a bullish crossover while a death cross happens when they make a bearish crossover.
Right settings for SMMA
Like all types of moving averages, there is no recommended periods to use when using this type of moving average. It is up to each trader to work and find the periods that work well for them.
Nonetheless, the most popular periods by short-term day traders are 14 and 28. For long-term traders, the most popular ones are the 50, 100, and 200-day moving averages.
Summary
The Smoothed Moving Average is an important indicator to use in day trading. Like all others, you should take time to find the best ways to use it. This includes spending a lot of time testing and backtesting it in a demo account.
Do you already have experience with this particular MA, or have you found any important insights to add to your strategies?
External Useful Resources
- Smoothing Data with Moving Averages – Dallas FED
