Trend reversal is an important concept in both day trading and investing. It refers to a situation where a stock or other asset changes direction and starts moving in another direction.
In this article, we will explain what a trend reversal is and how to identify it using price action strategies.
What is a trend reversal?
A trend is a situation where a financial asset is moving in an upward or downward direction. The opposite of a trending market is when the asset is ranging or moving in a volatile period.
A trend reversal, therefore, is a period when a financial asset ends the initial trend and starts a new one in the other direction.
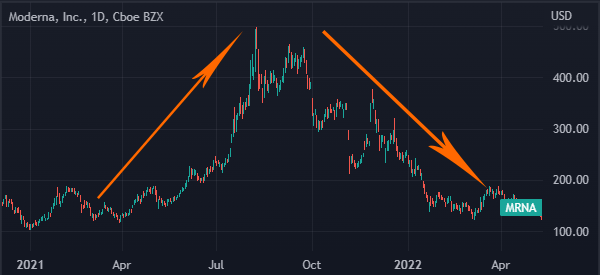
A good example of this reversal is shown in the chart below. As you can see, the Moderna stock price was in an upward trend during the pandemic. It then had a trend reversal when demand for these vaccines started waning.
Successful traders are those who know how to identify when a trend reversal is happening. If you can identify it early, you can easily ride the new supertrend that has emerged.
But also identify the end of the current trend before it is too late.
How to identify trend reversals?
There are two main ways of identitifying a trend reversal. First, there is the concept of using technical indicators like moving averages and the Relative Strength.
The other one is to use price action approach, which involves looking at chart and candlestick patterns.
Candlestick patterns
One approach of identifying trend reversals without using technical indicators is to use candlestick patterns. These are patterns that form within candlesticks.
Some of the most popular reversal patterns are doji, evening and morning star, bearish and bullish engulfing, hammer, hanging man, and three black crows among others.
Doji pattern
A doji pattern happens when an asset’s price opens and closes at the same level. There are several types of these doji patterns, including standard, long-legged, gravestone, and dragonfly doji patterns.
When they happen, they signal that a new bullish or bearish trend is about to happen. The chart below shows a long-legged doji pattern.
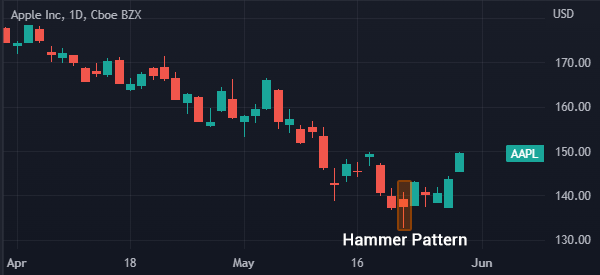
Hammer pattern
A hammer pattern is when an asset forms a small body and a long shadow. In most cases, the body does not have an upper shadow.
A good example of this is shown in the Apple chart shown below. In it, we can see that the hammer pattern has a small upper shadow.
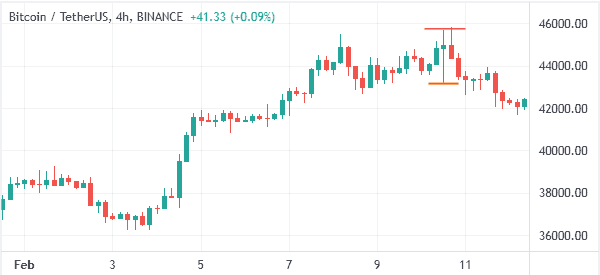
The same approach is seen when you consider the inverted hammer candlestick. This pattern forms when a candlestick has a small body and a long upper shadow.
When it forms. It is usually a sign that a new upward trend is about to form. An example of this is shown in the chart below.
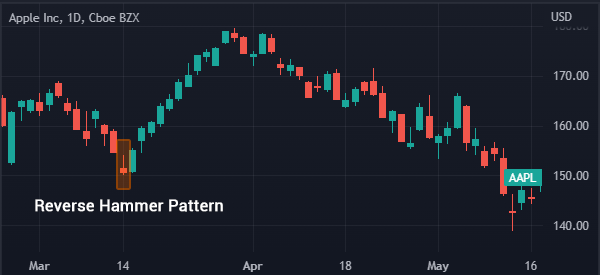
Chart patterns
In addition to candlestick patterns, many traders focus on chart patterns to identify new trend reversal patterns. There are many chart patterns that show when a new trend reversal is about to happen. Some of the most popular ones are:
- Head and shoulders
- Rising and falling wedge
- Double and triple top patterns.
- Rounding bottom
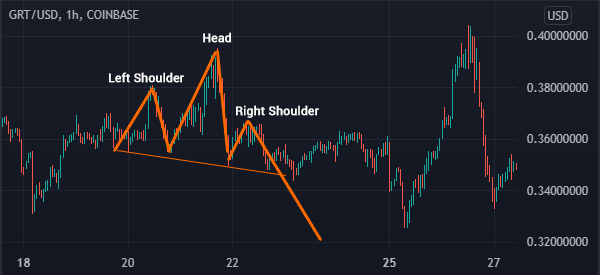
Head and shoulders
Head and shoulders form during an uptrend. When drawn well, the pattern has a close resemblance to the upper part of a person. The price has left shoulder, a head, right shoulder, and a neckline.
When this pattern forms it is usually a sign that the asset’s price is about to have a trend reversal. As such, you can place a short trade and then place a take-profit below the neckline.
A good example of this pattern is shown in the chart below.
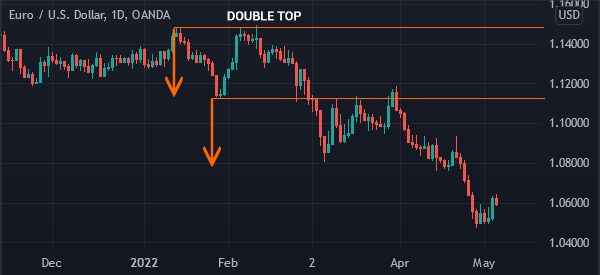
Double-top
A double-top pattern forms when an asset’s price rises and hits a resistance, then declines and bounces back to the initial resistance level.
A double-top can immediately lead to a bearish breakout. Alternatively, it can continue and form a triple-top pattern. Whenever these patterns form, the usually lead to a bearish breakout.
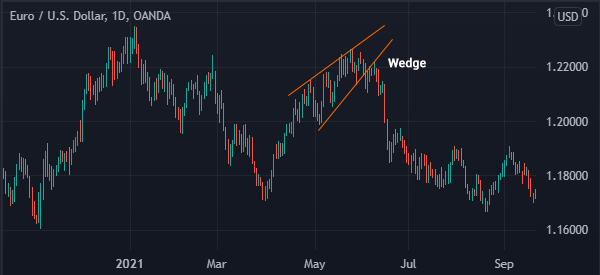
Rising and falling wedge
A rising and falling wedge pattern is an important one when it comes to reversals. A wedge happens when an asset forms a pointing channel.
The two lines of the channel tend to move in a converging pattern. As shown below, when this pattern forms, it usually leads to a breakout in the opposite direction.
These are just some of the best price action methods for reversal patterns. Here we have covered in more detail other chart patterns for trading reversals, candlestick and not.
Combining these patterns with indicators
It is perfectly fine to use these patterns without having indicators. However, most traders tend to combine them with technical indicators such as moving average and the Relative Strength Index.
For example, when using the head and shoulders pattern, you could initiate a sell trade slightly below the 200-day moving average.
Summary
In this article, we have looked at the concept of trading reversals and identifying them without using technical indicators.
The benefit of using these patterns is that they are easy to identify and that they are significantly easy to use. And in most cases, the patterns are usually fairly accurate.
External useful resources
- How do I identify correct swings and trend reversals in price action trading? – Quora
