In trading, market participants use two types of analysis. In fundamental analysis, they look at market news, economic, and earnings data to predict how a currency pair or any other asset will move.
Instead, in technical analysis, they look at charts and use various technical indicators to help them predict.
These technical indicators are divided into:
- Trend following
- Volumes
- Bill Williams
- Oscillators
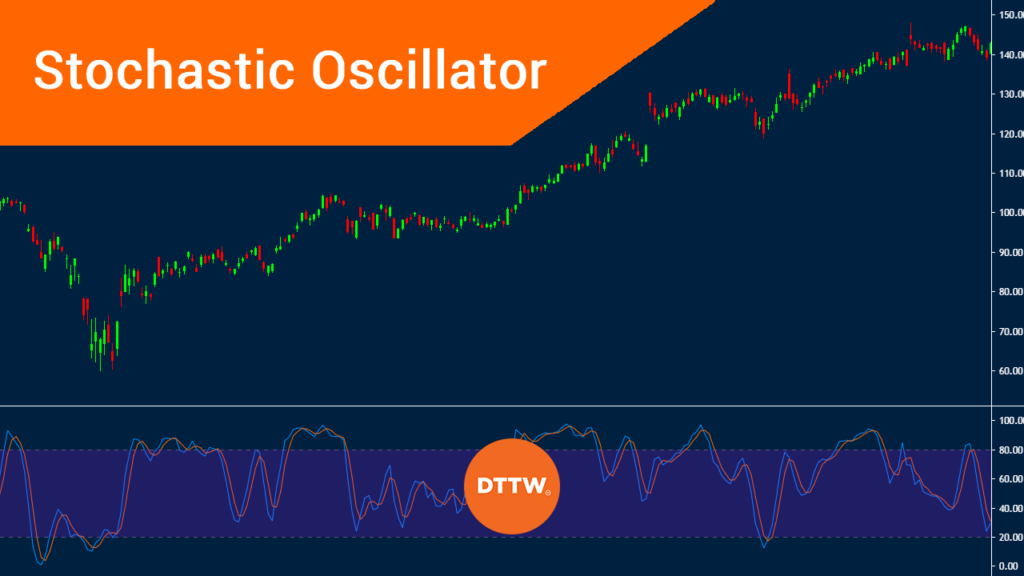
In this article, we will look at an indicator known as Stochastic oscillator, which is one of the most popular indicators used in the market.
What is Stochastic Oscillator?
Stochastic Oscillator is an indicator that was developed by George Lane, who was a well-known trader in the 1950s. The indicator is used to show the direction of the close relative to the high-low range of a certain duration.
Unlike other types of indicators that follow volumes and price, the Stochastic Oscillator is unique because it follows the momentum of the price. This is because momentum tends to change before the price.
As such, the indicator can be used to show when reversals will happen.
Calculation & Formula
The Stochastic Oscillator is calculated using a very simple method. First, you need to find the %K.
This is calculated using the formula below:
| (Current Close – Lowest Low) / (Highest High – Lowest Low) X 100 |
You then calculated %D. This is calculated by calculating the 3-day Simple Moving Average of %K.
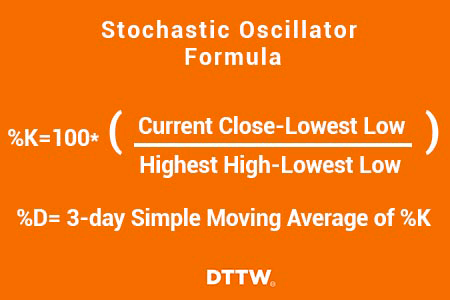
The lowest low and highest high are the lowest and highest levels during the specific period. In most trading platforms like MetaTrader, the default period is usually 14. However, you can tweak this period to match your trading style.
Also, as with many traders, you don’t need to know how to calculate these figures. You just need to know how to apply them.
3 Types of stochastic
Another thing you need to know is that there are three types of Stochastic Oscillators. These are fast, slow, and full oscillator.
The Fast oscillator is based on the original computation suggested by Lane. However, the %K calculated can be a bit unreliable.
The slow oscillator removes this by removing then emphasis because the %K in the slow stochastic oscillator is equal to the %D in the fast oscillator.
How does Stochastic Oscillator work
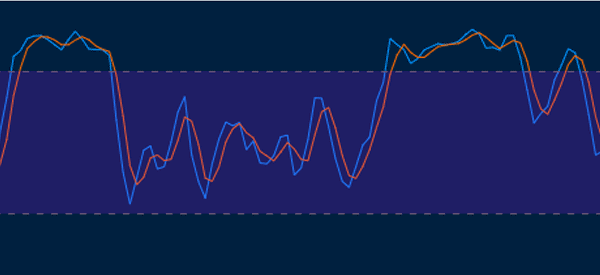
When you put a stochastic oscillator on a chart, you will see two lines of different colors, the main and signal lines. You will also see two main levels of 20 and 80. Ideally, when the two lines are below 20, the pair is said to be oversold and when the lines are above 80, it is said to be overbought.
Find when the two lines intersect
One way that traders use Stochastic Oscillator is to buy when the two lines intersect below the oversold level. They ride the upward trend until the two lines intersect above the overbought level. This is shown in the chart below.
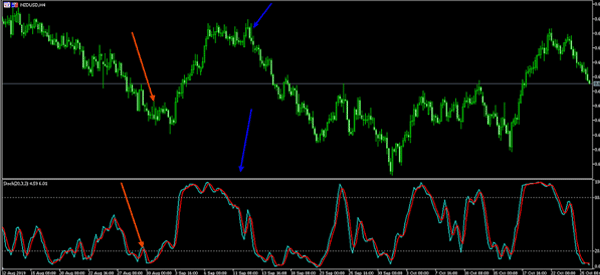
As shown above, a sell signal emerged when the two lines intersected while being above the overbought level. A buy signal emerged when the same happened in the opposite direction.
Pay attention to false signals
There are several things you need to know. First, the Stochastic Oscillator is famous for giving false signals. Therefore, it is always good to combine it with other technical indicators and charting tools like Fibonacci Retracement and Pitchfork.
How to Use the Stochastic Oscillator
Watch for trends
There are several strategies of using the Stochastic Oscillator well. First, always ensure that the price of the asset you are studying is trending. That’s because the indicator will always give you false signals when you use it in a ranging market.
K & D values
Second, look at the K and D values. In most cases, the K value is usually 14 and the D value is 3. Still, as a trader, you can tweak the data to meet your trading criteria. In fact, before you use it in a live account, we recommend that you find your sweet spot in a demo account.
Search overbought and oversold levels
Third, apply the indicator and see the result. Ideally, a common strategy, as mentioned, is to look at the overbought and oversold levels. If the two lines cross the overbought level, it can be a sign to short. Similarly, if it crosses the oversold level, it might be a time to sell.
However, as you will find, at times, the two lines of the Stochastic will remain in the overbought level for a while. During this time, the price will continue to rise. Similarly, at times, the two lines will remain in the oversold level while the price is falling.
Therefore, you should always be patient about this.
Wait for crossovers
Another way of using the Stochastic oscillator is to wait for the two lines to crossover. When the price is rising and the two lines makes a crossover, it could be a sign to sell and vice versa.
In most cases, a bullish signal emerges when the two lines of the oscillator make a crossover below the oversold level.
On the other hand, a bearish signal comes up when the two lines of the oscillator makes a crossover above the overbought level. However, as you will see often, it is not a reliable indicator to use these crossovers.
Find divergences
Finally, you can use the Stochastic Oscillator to find divergences. A divergence is when the price of an asset is rising while the indicator is falling. When the divergence happens, it is usually a sign that a reversal is about to happen.
Trading divergences is usually a difficult thing to do with the Stochastic Oscillator. Therefore, we recommend that you use it with other oscillators like the MACD or the Relative Strength Index.
Stochastic oscillator settings for day traders
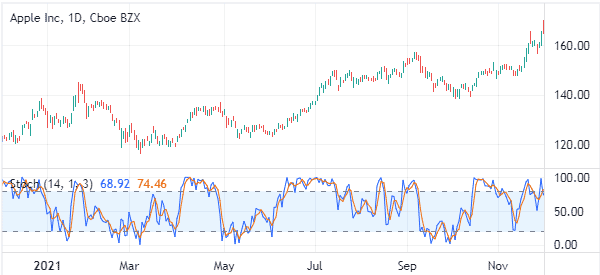
A common question among traders is the best stochastic oscillator settings to use when day trading. In most cases, it is usually recommended that you use the default settings provided by your trading platform.
In this case, you should use the %K length at 14 and %K smoothing at 1. Finally, you should use the %D smoothing at 3.
You can tweak the colors to meet your trading criteria. Also, you should leave the upper overbought band intact at 80 and the lower band at 20. The chart below shows a typical setup for a day trader.
Stochastic vs Stochastic RSI
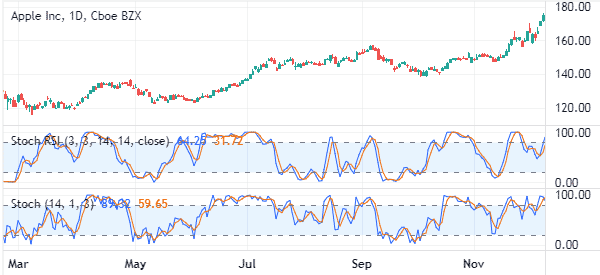
In the previous parts, we have explained what the Stochastic Oscillator is. A common question is on the difference between the oscillator and the Stochastoc RSI or the StochRSI.
It measures the level of the RSI relative to its high-low range over a certain period. It applies the stochastic formula to RSI values. The chart below shows the two indicators applied on a chart.
Final thoughts
The Stochastic oscillator is one of the most popular oscillators and technical indicators in the market. It is mostly used to identify overbought and oversold levels. Also, it can be used to identify divergences in the market.
To use it well, we recommend that you take time to try it in a demo account. This will help you identify the best periods to use. It will also help you come up with a good trading strategy.
External useful Resoruces
- Stochastic Oscillator Definition – Investopedia
- How to Use the Stochastic Indicator for Forex Trading – Babypips
