Stock Volume is an important concept in the financial market. It refers to the average number of shares that are being traded in a certain period. As such, it is one of the most popular and important concepts that professional traders use.
This is because, as you can imagine, the volume of a stock has a strong impact from several points of view (such as shares liquidity and volatility).
In this article, we will look at what stock volume is, some popular volume indicators for the analysis phase, and how to use it in day trading by incorporating it within your strategy.
Stock Volume Meaning
As mentioned, stock volume is the number of shares that are in a certain period of time. Ideally, a stock that is rising and one that has a high volume is said to be a better buy than one that is rising with low volume. This is simply because it means that the rising trend is being backed by volume.
On the other hand, a falling volume in a stock whose volume is dropping down is often a sign that the price could start falling.
But then..What does a stock volume mean?
It is worth noting that, in stocks, volume can mean different things. For example, it can mean the number of shares that are being traded in a certain period. It can also refer to the number of options contracts and the number of shares traded within an index in a certain period.
Volume in stock market: key features
A single-day volume is a useful feature. However, it usually does not tell the real story. For example, if 1 million shares of a company are traded in a given day, it means nothing.
However, if the 20-day moving average of this volume is 300,000, it means something. It reflects a fact that something could have pushed more people into the stock.
Another notable item is that volume is calculated once. For example, if there are two traders and one sells 1,000 shares and the other buys 1,000 shares, it means that the volume is 1,000.
Volume in other assets
Volume is an important concept not only in stocks. It is common across other asset classes like cryptocurrencies, commodities, and currencies
Ideally, you should trade stocks that have a higher volume because it shows how liquid they are. As a penny stock trader, consider this scenario: you’ve invested in a million shares of a company.
Now, here’s the challenge – when the time comes to exit the trade, you may encounter difficulties in finding buyers due to the limited liquidity of these stocks.
How volume reflects market sentiment
Volume is an essential concept in explaining an asset’s sentiment among investors and traders. Broadly, a stock with higher volume means that it has more buyers and sellers in the market.
If the bullish volume is rising, it means that there are more people buying it during the specific period. On the other hand, when the bearish volume is rising, it is a sign that the downtrend will continue.
Further, when there is little or no volume, it means that an asset is not popular among investors and traders. Buying an asset with little volume can be highly risky since it can mean it is less liquid. Also, low-volume stocks can be victims of short squeezes and pump and dump schemes.
Volume vs liquidity
A common question is on the difference between volume and liquidity. Volume refers to the amount of shares that are traded during a session. Liquidity, on the other hand, refers to the ease of entering and exiting a trade. It refers to how active a market is.
Therefore, in this regard, volume and liquidity have a close relationship. In most cases, a stock with high volume usually has a higher level of liquidity. Stocks like Apple, Microsoft, and Google have higher volume and are extremely liquid.
How does volume affect an asset price?
A key question among traders is whether an asset’s volume has an impact on its price. The answer is that volume is an important part in determining an asset’s price. In most cases, traders look at the type of volume, whether bullish or bearish.
In this case, if an asset has a higher green volume, it means that more investors are buying the stock. As a result, traders will be inclined to continue buying the asset, which will push it higher in that period.
Similarly, if an asset has a higher red volume, it means that more people are selling, which will lead to more downside.
Volume can also affect other things in the market. For example, it can affect the price of an asset, especially in the forex and CFD market. Thinly traded assets have higher spreads, which leads to higher trading costs.
Most importantly, volume can show you divergences or when an asset is about to change its direction.
Intraday vs historical volume
There are two main ways of using an asset’s volume when trading. The first one is where you look at the asset’s intraday volume or turnover. This figure simply shows you the total volume of shares that are being exchanged during the day.
The other crucial volume is known as the historical volume. While the intraday volume is an important metric, it does not tell the whole picture of an asset. This volume only works well when compared with the average one in a certain duration.
Related » Why historical data matter
For example, the volume of PayPal shares at the end of October 2023, was 19.1 million. The 3-month average volume was 15 million. This means that the shares are seeing a higher relative volume, which means that an important thing is about to happen.
The best way to look at this volume is to use data platforms like Yahoo Finance, Bloomberg, and WeBull. These platforms show an asset’s volume and their average. You can also use several charting platforms to read the volume.
Market movers and volume
The volume of an asset is also impacted by key market movers. First, the biggest driver of this is a company’s earnings. When a company publishes its earnings, the stock can either rise or fall. And since these stocks make headlines during this time, it means their volume tends to rise.
Second, mergers and acquisitions are key drivers of volume. A stock’s volume will typically rise when an M&A deal is announced. The company being acquired volume will rise as more investors seek to take advantage of this. The acquirer might see a higher red volume.
Third, geopolitical events like wars can have an impact on volume. In most cases, when there are geopolitical risks, volume tends to rise as investors take advantage of these events in the market.
Other key movers are new product launches, major reversals, an interview by the company’s CEO, and an analyst rating downgrade or upgrade.
How news and social media affects volume
An important aspect about volume is that the news of the day can lead to more activity. In most cases, many traders and investors either buy or short stocks that are in the headlines. For example, the volume rises when a company publishes its earnings.
At the end of October 2023, Tesla has just released its earnings, bringing the volume to 136 million. The three-month average volume was 114 million.
In addition to earnings, there are other major news that move assets. For example, there is news on mergers and acquisitions, a new product launch, and the decision by the FDA to accept or deny a drug approval.
For example, at the same time mentioned above, Pioneer Natural Resources had a daily volume of 5 million shares, higher than the three-month average of 2.6 million. This happened after Exxon decided to buy the company.
Social media has also become a major part of the market. Its role increased during the Wall Street Bets period, when Reddit and StockTwits made headlines. In most cases, stocks trending in these platforms tend to have higher volume.
Where stock volume data comes from
Another important question is where the data on volume comes from. To answer it well, you need to first understand how the stock market works and the players involved.
First, there is you, the trader, and a seller. Second, there is a stockbroker, who provides the trading platform. Examples of brokers are Robinhood, Fidelity, and Schwab, among others.
Third, there are market makers, which are companies that match buyers and sellers. These are companies that actually implement the trades. Examples are Citadel Securities and Virtu Finance. Finally, there are the exchanges themselves. These are companies like Nasdaq and the New York Stock Exchange (NYSE).
Therefore, whenever someone buys shares, the transaction is recorded as volume. Traders can therefore use this data to see the trend in volume.
Related » Direct Market Access vs. Retail Trading
How to get volume data in stocks
Another aspect is where one can get the data on volume when trading stocks. There are many places. For example, you can use the volume indicator tool that is provided by your broker.
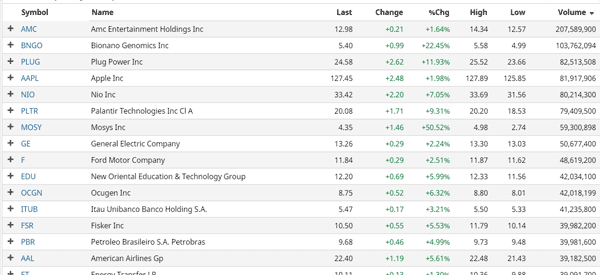
Alternatively, you can use tools like YCharts and Barchart that compile this information. The chart below shows stocks that had the most volume on May 14, 2021. The list includes companies like AMC, Apple, and Plug Power, among others.
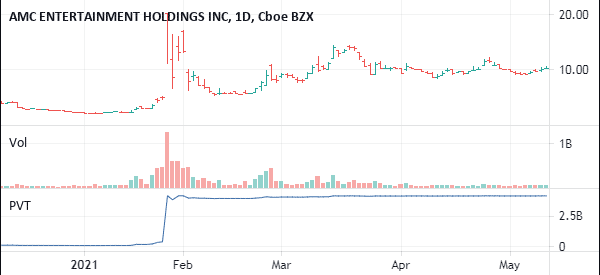
As mentioned above, the daily volume is only important when it is put into perspective. On the chart below, we see the volume trend of AMC shares. As you can see, the company was thinly-traded in the fourth quarter of 2020. The volume rose sharply during the Wall Street Bets fiasco, and then faded. It then rose in April after the company raised money to finance its operations.
Volume indicators in trading
There are several indicators that help you to take advantage of volume when trading stocks. Some of these are:
- The accumulation and distribution indicator
- Volume indicator
- On balance volume
- Volume moving average
- Volume-Weighted Average Price (VWAP).
- Price volume trend
- Negative Volume index
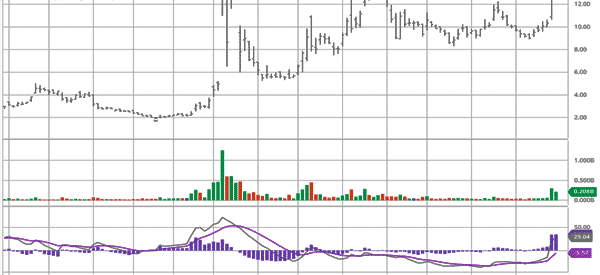
The chart below shows the AMC stock with the volume and percentage volume oscillator indicator.
Volume patterns in trading
Volume is used in various ways by traders and investors. First, you can use volume to check out an asset’s accumulation. Accumulation is characterized by higher relative volume and no major movements of an asset. In most cases, smart money investors buy stocks in small chunks to prevent big moves.
Second, you can also use the volume to confirm a trend. After the accumulation, you can use volume to confirm an asset’s trend. The volume also rises when an asset price is rising during the markup phase.
Third, volume can also be used to trade breakouts and confirm breakdowns. In most periods, the price tends to move differently when it moves in these phases.
Most active stocks (and not)
As mentioned above, volume is important in the market. And as a day trader, you should focus on companies that have a relatively high amount of volume instead of those that are thinly traded. This is because these stocks are more likely to have fluctuations that can be exploited to generate some profit.
Some of the highest volume stocks are companies in the technology industry like Apple, Netflix, Facebook, and Nvidia. On the other hand, some low volume stocks are small companies in industries that are not popular like farmlands and the industrial sector.
Causes of high volume in stocks
There are several key causes of volume in the stock market. Some of these are:
- Earnings – In most cases, the volume of a stock increases during the earning season since this is when more people and investors are buying or selling.
- M&A news – The volume tends to rise when there is mergers and acquisition activity.
- Company-specific news – Volume tends to increase when there is company-specific news like management changes and new entrants of a competitor.
- Fiscal and monetary policy – Policies by the government like stimulus and those of central banks like rate cuts and QE can lead to higher volume.
Guidelines to use volume in trading
You can use volume to confirm a trend, show trend exhaustion, and identify and confirm breakouts. First, you can use volume to confirm an existing trend. This happens when an asset is rising or falling. In most cases, this view is confirmed when the asset has a higher relative volume.
Second, you can also use volume in trend exhaustion. When there is an uptrend, you can confirm a trend exhaustion when the price is rising while the volume is falling.
Finally, you can also use volume to confirm breakouts. This happens when an asset in consolidation makes a bullish or bearish breakout. You can confirm the strength of this breakout by looking at the volume. If it has higher volume, it means that the breakout will likely continue.
Conclusion: volume matter for day traders?
The concept of volume is a relatively wide one. However, what you need to know is the importance of volume in the financial market. So… the answer is absolutely yes! Stock volume is one of the key factors to look at before starting a trade.
In this article, we have looked at what volume is, how to use it in day trading, and some of the indicators you can use. But given the breadth of the topic, we’ll have much more to say.
External useful Resources
- What does volume in stocks indicate? – Quora
- What is considered a bad volume? – Reddit/r/stocks
