Technical analysis is one of the few approaches that people use to analyze stocks and other financial assets like cryptocurrencies, commodities, and bonds.
The most popular approach to technical analysis is the use of technical indicators, which are based on mathematical calculations.
There are indicators for every scenario, such as trend or reversal trading, and many can serve multiple purposes. Some traders, however, rely too much on their use and end up losing part of their account.
In this article, we will explain what you need to know about indicators and show some tricks to help you use them at a higher level.
What are technical indicators?
Technical indicators are tools based on mathematical calculations that provide traders with the signals they need as they enter positions.
There are thousands of indicators in existence today, with some of the best-known ones being:
- Bollinger Bands
- Volume Weighted Average Price (VWAP)
- Moving averages
Bollinger Bands are calculated by simply finding the moving average of an asset and then finding its standard deviation. It has three lines, the moving average, and the two standard deviations and is mostly used in trend-following.
Moving averages, on the other hand, are calculated by finding the rolling average of an asset in a certain period. Examples of MAs are:
- Simple
- Exponential
- Volume-weighted
- Smoothed
among others. Other popular technical indicators are the Relative Strength Index (RSI) and Stochastic Oscillator among others.
Do technical indicators work?
A common question is whether technical indicators work well in the market. The opinion about this is mixed, with many investors arguing that they don’t work. Many day traders, on the other hand, believe that these indicators work very well.
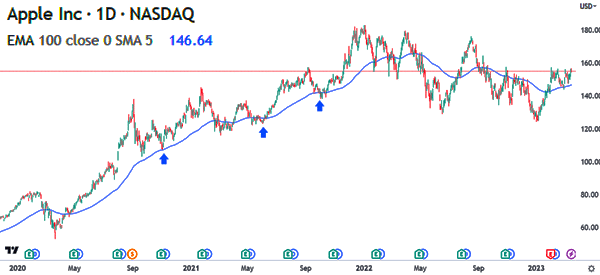
The right answer about this is that technical indicators work although there are caveats. A good example to show that some indicators work is in the chart below.
In it, we see that the Apple stock price remained above the 100-day exponential moving average during its climb.
However, the reality is that many of the technical indicators in existence today don’t work at all. Therefore, you should be extremely careful when using these tools in your day trading.
Drawbacks of technical indicators
There are numerous drawbacks to technical indicators. Let’s see some of the most important bottlenecks that you need to know about.
Indicators are based on historical data
The first major challenge for technical indicators is that they are created using historical data. For example, moving average is calculated by taking historical data and dividing it by the respective period.
Similarly, Bollinger Bands are calculated by first solving the moving average followed by the standard deviations.
Therefore, the accuracy of these indicators always depends on the data used in their calculations. Most importantly, in many cases, these numbers don’t take into account the news and economic data of the day.
Therefore, the biggest drawback of technical indicators is that they don’t necessarily predict what will happen in the future because they use historical numbers. They simply don’t take into consideration the events of the day.
Indicators can be used wrongly
The other drawback for using technical indicators is that they can often be used wrongly or in ways that they were not intended.
A good example of this is an indicator known as the Commodity Channel Index (CCI), which is a popular oscillator. The indicator was initially used to analyze commodities like corn, wheat, and soybeans. Today, it is popularly used to analyze all assets, which can lead to false signals.
Therefore, you can eliminate this risk by ensuring that you are using your technical indicators well. For example, you should take time to learn more about these indicators before you move to a live account.
Indicators can be subjective
A common challenge with technical indicators is that they can be highly subjective. In most situations, what an indicator tells you can be significantly different from what it tells another person. A common reason for this is that indicators show different signals when different timeframes are used.
In most cases, the moving averages of a stock can show a bullish crossover on the daily chart. They can then show a bearish crossover on other charts. Another example is where the Relative Strength Indicator (RSI) shows mixed results.
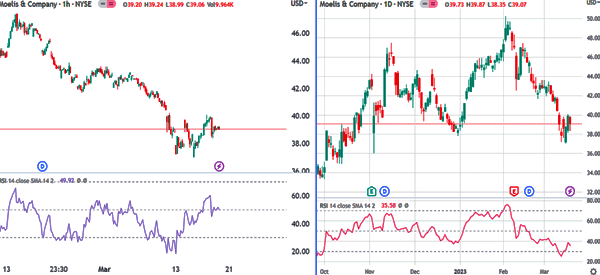
A good example of this is in the Moelis stock below. On the hourly chart, we see that the Relative Strength Index (RSI) is moving upwards. In the daily chart on the left, the opposite is happening.
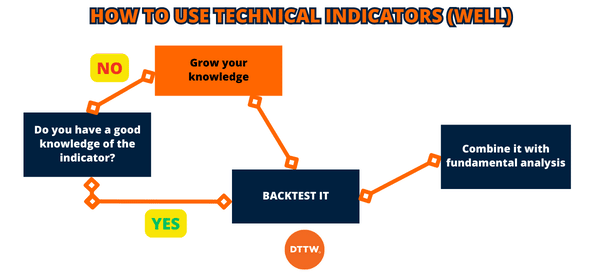
How to use technical indicators well
So now that we have finished listing some common drawbacks of using technical indicators you may be a little scared. However, there are some solutions that you can do to make your trading work well.
Backtest your indicators
The first thing you need to do is to backtest your technical indicators in a demo account before you switch to a live account.
In this process, you will spend a few months identifying the indicators you will be using to day trade and the best periods to use.
Some traders prefer using the 25-period and 50-period moving averages on the four-hour chart. Other traders prefer using the two moving averages on the daily chart.
Combine technical with fundamental analysis
The next thing to consider is to combine technical with fundamental analysis. Fundamental analysis is the process of using economic data and news to predict whether to buy or sell an asset.
For an example of fundamental analysis in the stock market is to look at a company’s news such as earnings to determine whether to buy or sell the shares. In this case, you will use technical indicators to identify the key levels to watch.
Good understanding of the indicator
Finally, you should have a good understanding of the indicator you want to use. We recommend that you take time to learn more about how the indicator works and the best conditions to use it.
At Real Trading, our TraderTV traders focus on the Volume Weighted Average Price (VWAP) indicator to make their trading decisions.
Summary
In this article, we have looked at how technical analysis works and some of the main drawbacks for using them in day trading.
We have also highlighted some of the top tips to use when using these indicators in day trading and creating your plan.
The rule is to know how they work, backtest them, and then combine them with fundamental analysis strategies.
External useful resources
- Are Technical Indicators Effective? – Toward data science
